AGU 2019 - New Science from NASA's Parker Solar Probe Mission
Little more than a year into its mission, Parker Solar Probe has returned gigabytes of data on the Sun and its atmosphere. The very first science from the Parker mission is just beginning to be shared, and five researchers presented new findings from the mission at the fall meeting of the American Geophysical Union on Dec. 11, 2019. Their research hints at the processes behind both the Sun's continual outflow of material — the solar wind — and more infrequent solar storms that can disrupt technology and endanger astronauts, along with new insight into space dust that creates the Geminids meteor shower.
Speakers:
Nicholeen Viall - Research Astrophysicist, NASA's Goddard Space Flight Center
Tim Horbury - Professor of Physics, Imperial College London
Kelly Korreck - Astrophysicist, Head of Science Operations for SWEAP Suite, Harvard and Smithsonian Center for Astrophysics
Nathan Schwadron - Presidential Chair, Norman S. and Anna Marie Waite Professor, University of New Hampshire
Karl Battams - Computational Scientist, U.S. Naval Research Laboratory
Animation of solar wind
Credit: NASA/GSFC/Adriana Manrique Gutierrez
Movie of data from the WISPR instrument on Parker Solar Probe. Credit: Naval Research Laboratory/Johns Hopkins Applied Physics Lab
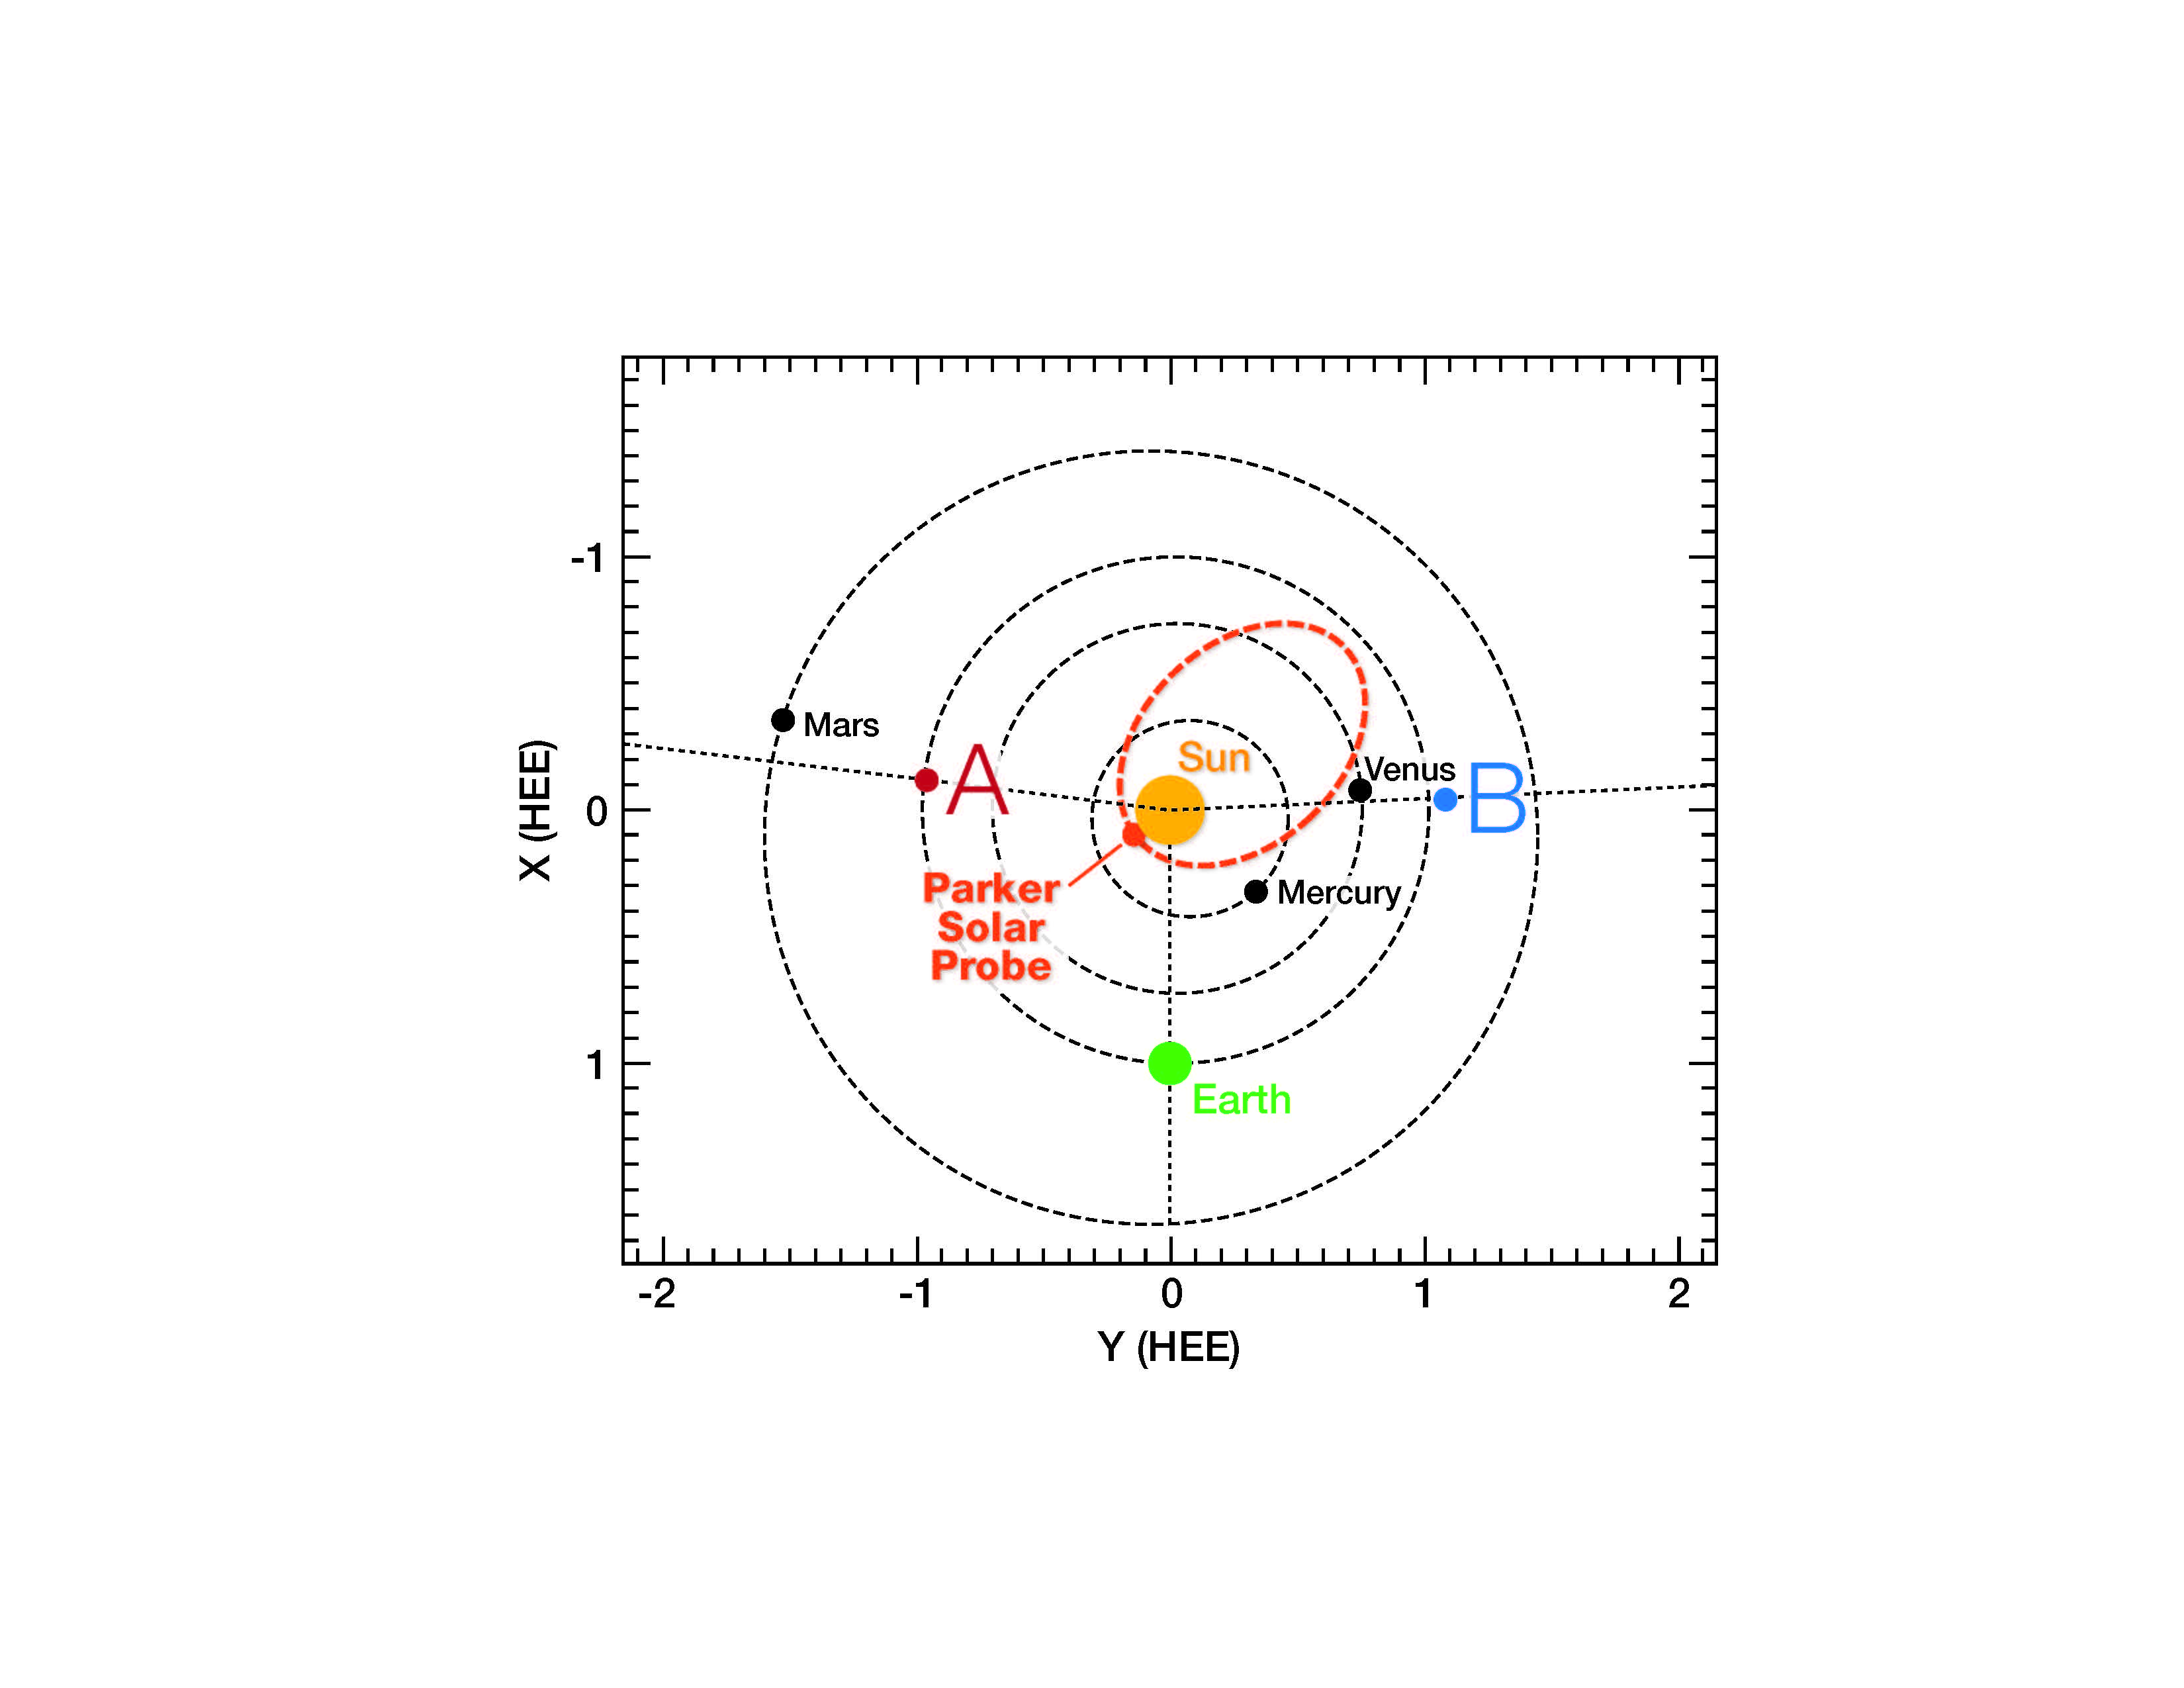
Graphic showing the orbit of STEREO, Earth and Parker Solar Probe around the Sun. Its from the STEREO webpage. Credit: NASA
STEREO images of the solar wind that Parker Solar Probe sampled, but using running difference (i.e. image processing to enhance the smaller features). Credit:NASA/STEREO/Angelos Vourlidas.
Cartoon of the structures we see in WISPR and STEREO to scale when they get to Earth and compress Earth's magnetic fields. Credit: NASA/Larry Kepko
Movie of STEREO images of the solar wind that Parker Solar Probe sampled, with an icon representing Parker's path through the field of view. Credit: NASA/STEREO/Angelos Vourlidas.
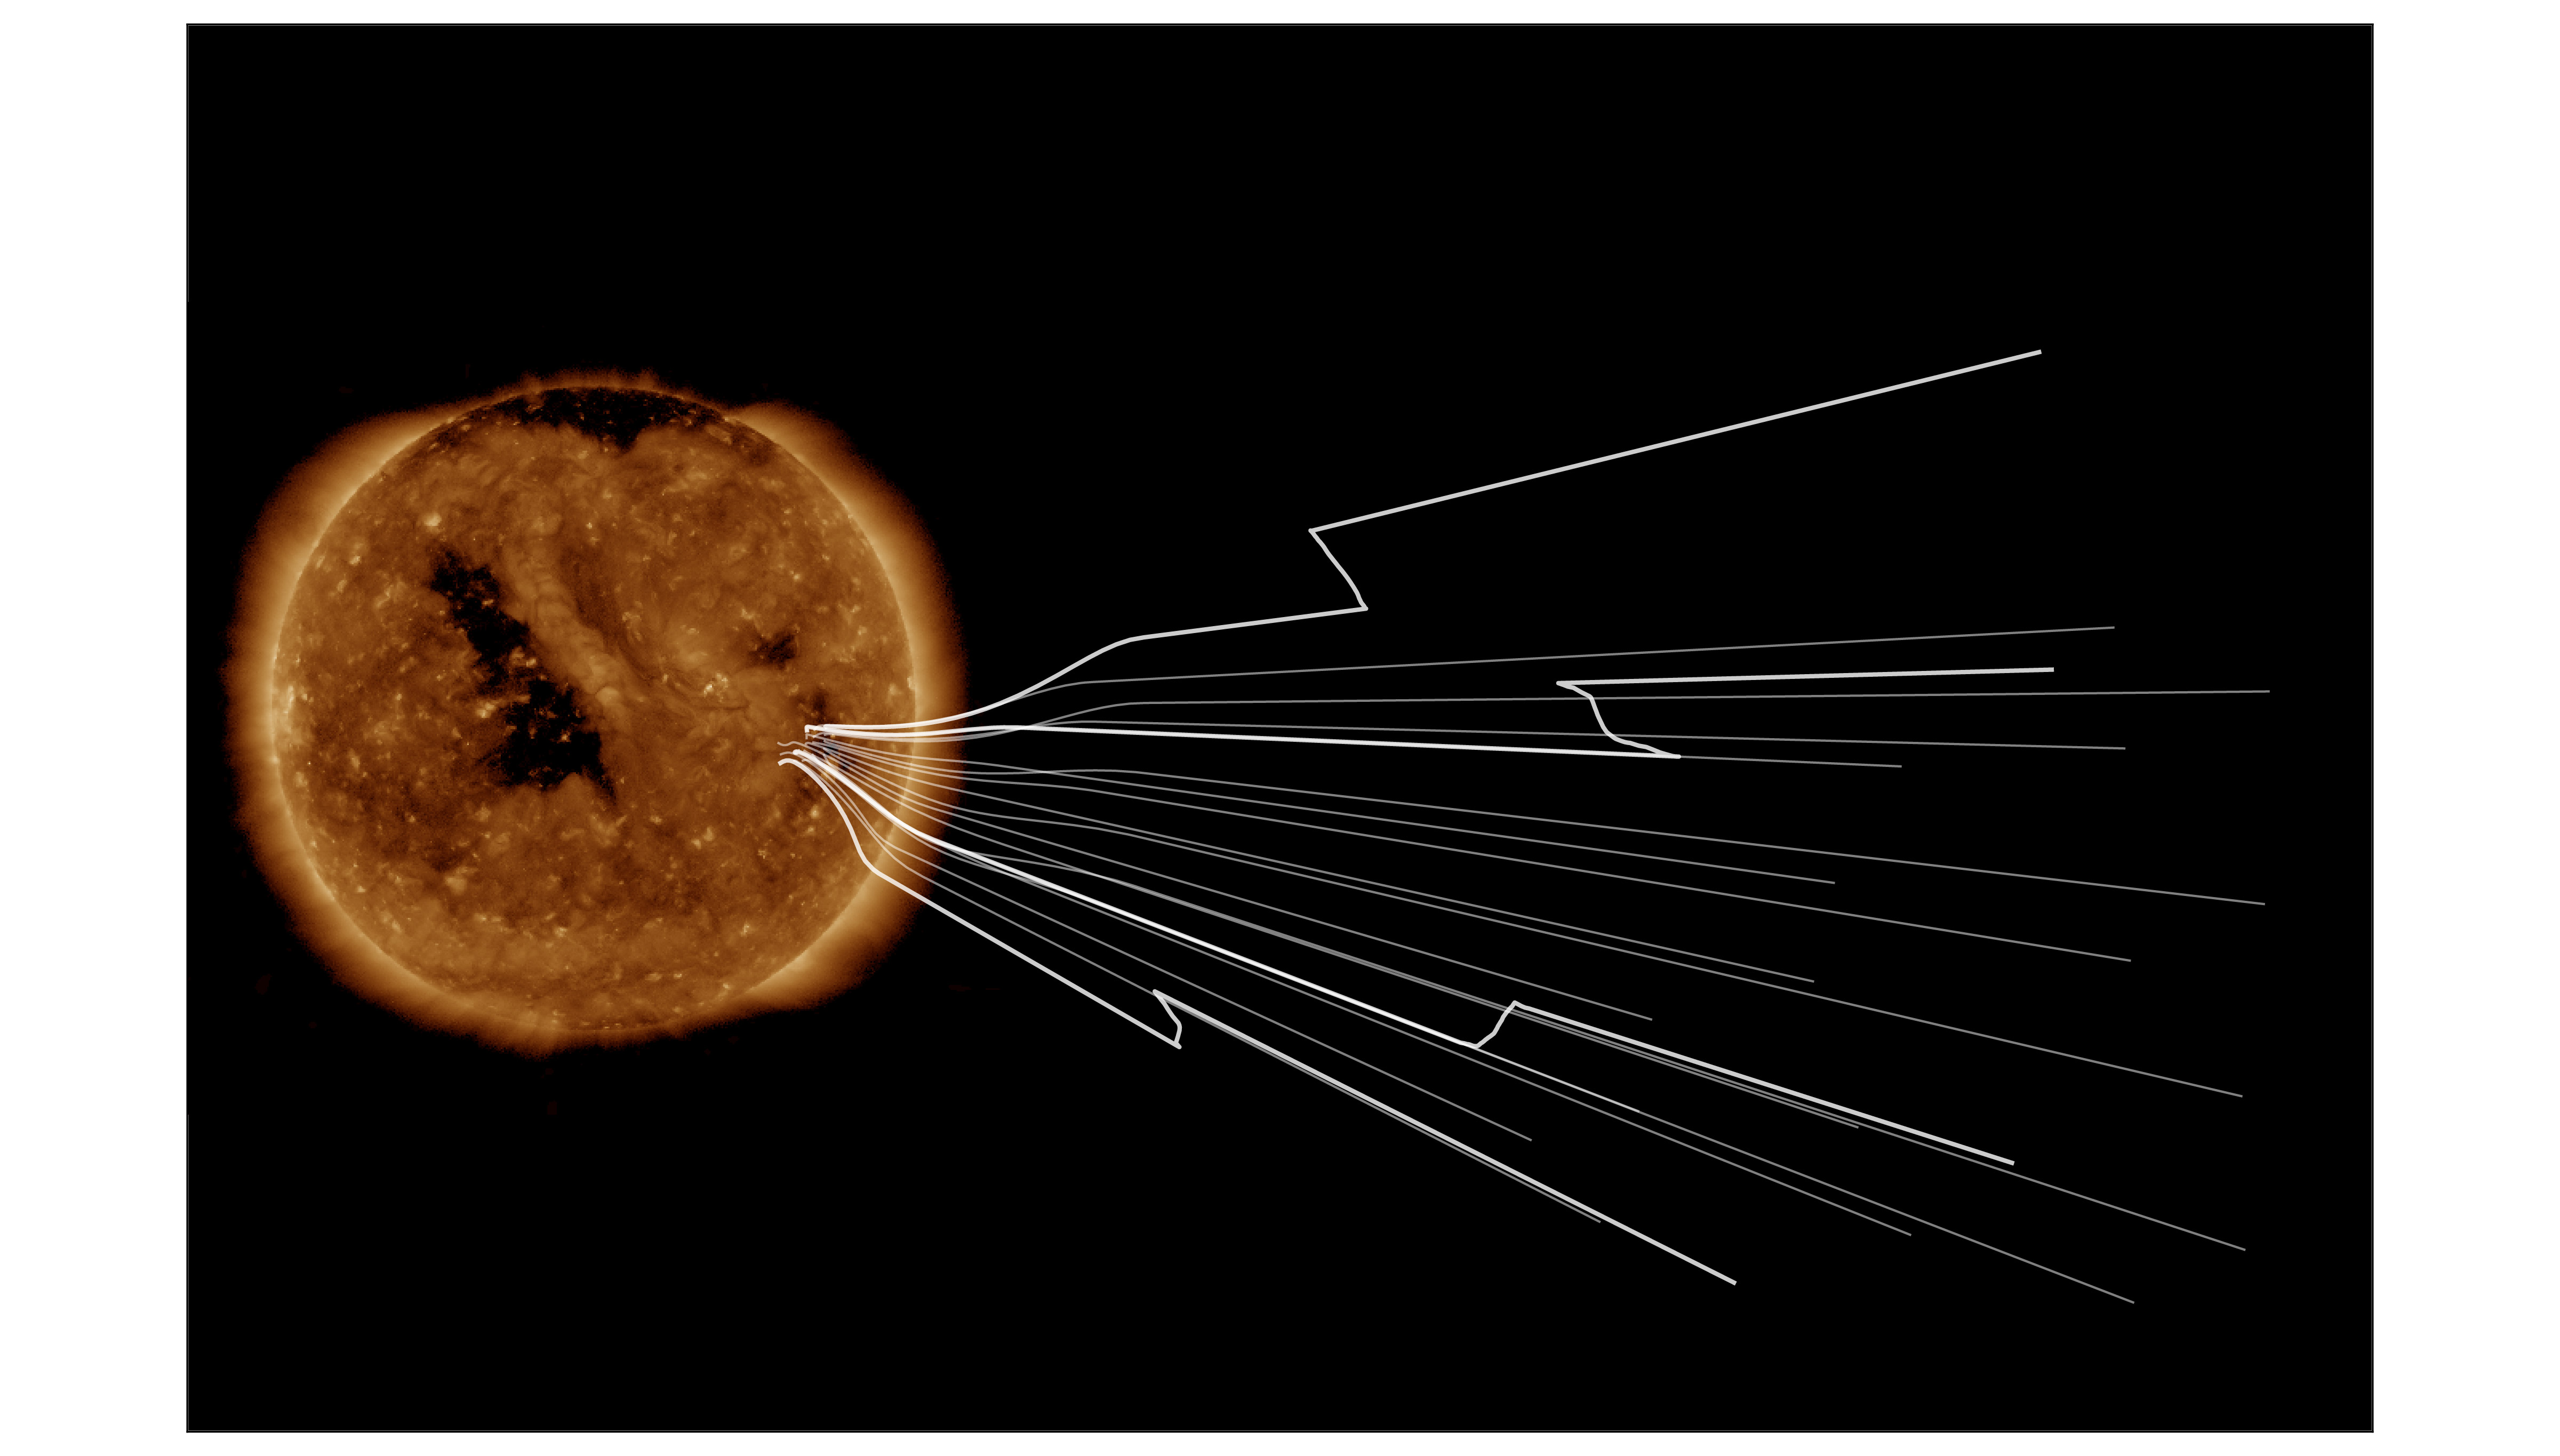
The Sun, in UV light, during Parker Solar Probe’s first closest approach in its first orbit. White magnetic field lines are shown originating in a small coronal hole; kinks, based on real Parker measurements, show the switchbacks observed during the encounter.
Credit: Imperial College/Ronan Laker/GONG/NASA/HelioPy/PFSSPy
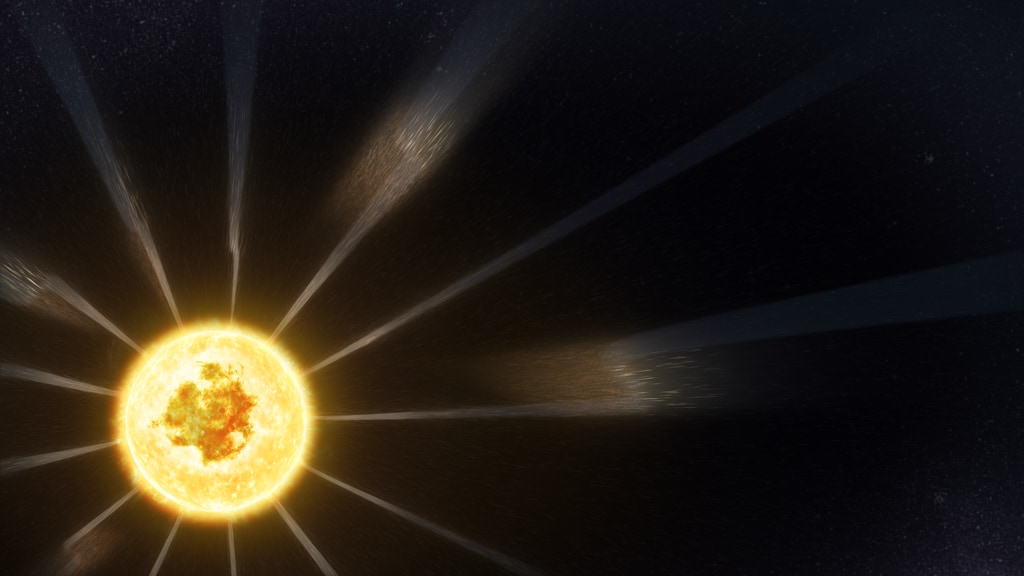
Parker Solar Probe flew through several ‘switchbacks’ – tubes of fast solar wind emerging from coronal holes in the Sun’s upper atmosphere. Credit: NASA/GSFC/CIL/Adriana Manrique Gutierrez
The Sun’s atmosphere in ultraviolet light during Parker Solar Probe’s first perihelion; bright spots show regions where magnetic energy is released to heat the plasma. Credit: NASA/SDO
Extreme Ultraviolet images from NASA's STEREO SECCHI EUVI instrument showing the Sun's hot corona from November 9-11, 2018.
Credit: NASA/STEREO
One of the fastest CMEs in years was captured by the STEREO COR1 telescopes on August 1, 2010. This movie, combining COR1-Ahead images with the simultaneous Helium II 304 Angstrom images from the STEREO EUVI telescope, shows the rapid explosion of material outward, followed by a slower eruption of a polar crown prominence from another part of the Sun. This CME is seen to be heading towards Earth at speeds well over 1000 kilometers per second.
Credit: NASA/STEREO
Running Difference movie from NASA's SECCHI COR 2 imager on STEREO A. This shows a coronal mass ejection lifting off on the left side of the video that Parker Solar Probe flew threw in November 11-12 2018.
Credit: NASA/STEREO
This clip shows the particle flow around the Earth as the CME strikes. Full movie at http://svs.gsfc.nasa.gov/3902
Credit: NASA/Goddard Space Flight Center Scientific Visualization Studio
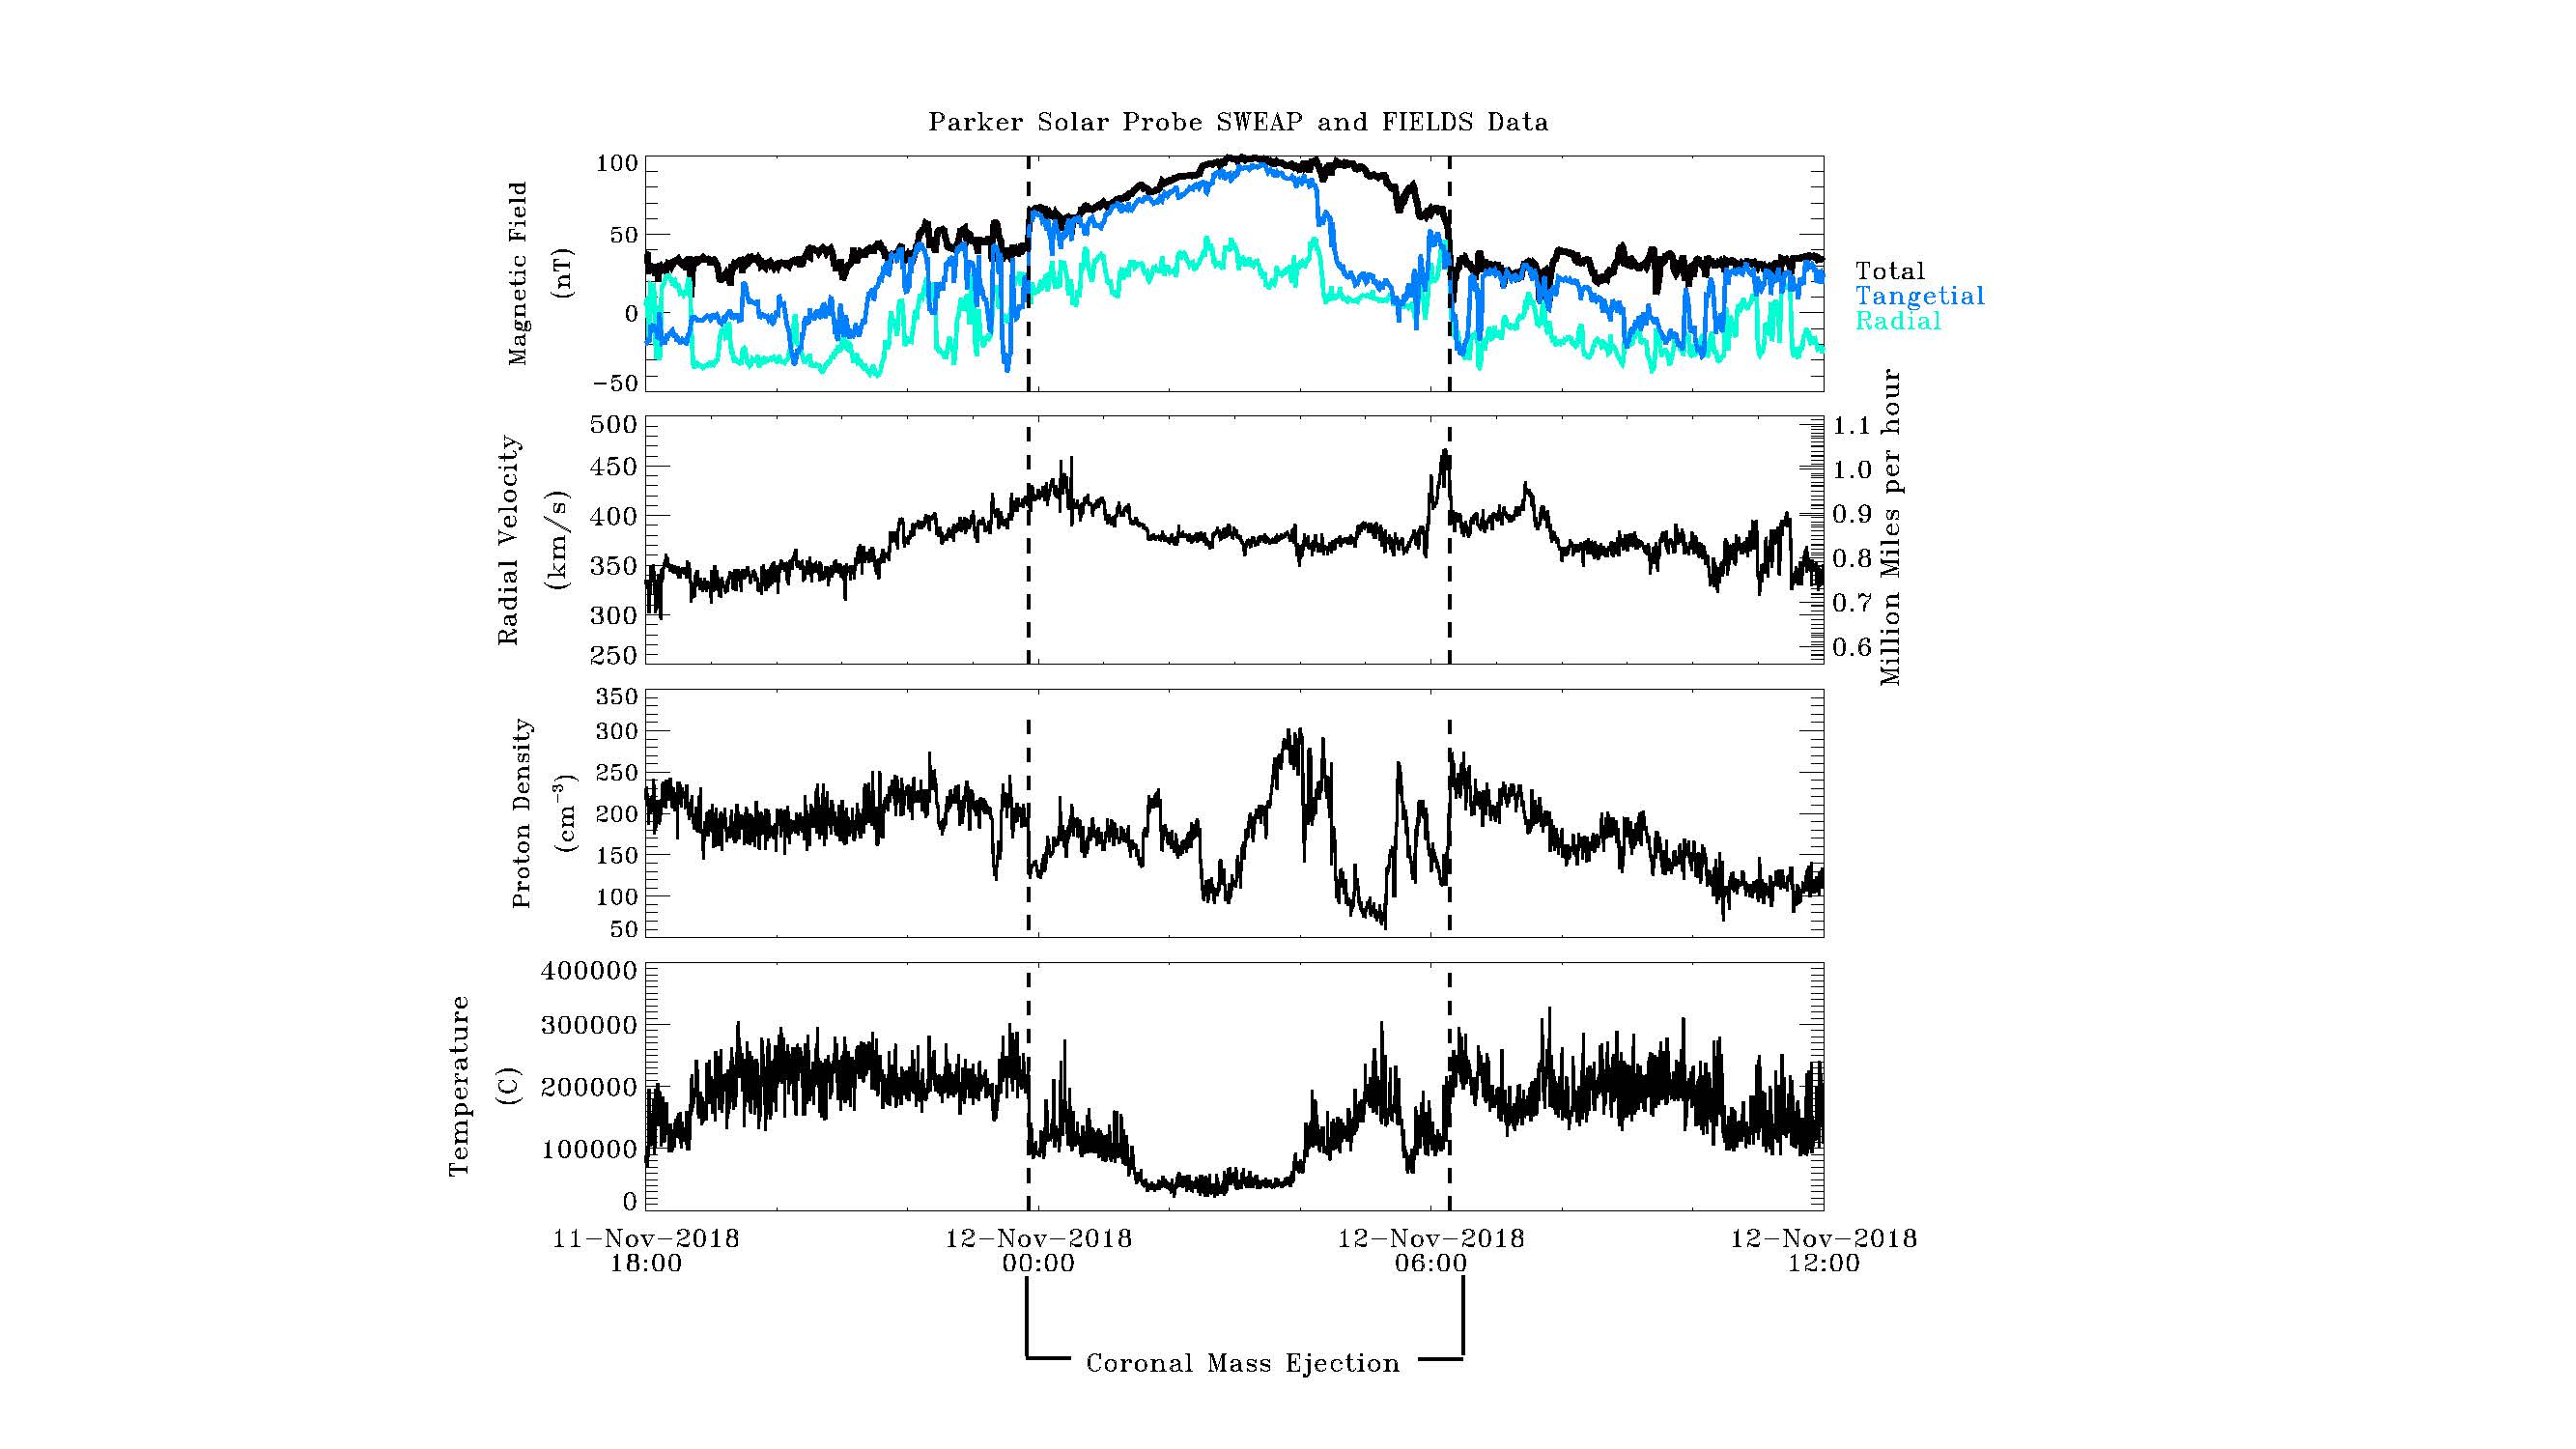
Parker Solar Probe plasma and fields data from November 11-12, 2018 that measured a Coronal Mass Ejection.
Credit: NASA Parker Solar Probe Mission, the SWEAP team led by J. Kasper, and the FIELDS team led by S. Bale for use of data.
Here's a view of the Sun, from the point of view of a fleet of Sun-observing spacecraft - SOHO, TRACE, and RHESSI. The time scales of the data samples in this visualization range from 6 hours to as short as 12 seconds and the display rate varies throughout the movie. The region and event of interest is the solar flare over solar active region AR9906 on April 21, 2002. In this visualization, black corresponds to no (current) instrument coverage.
Credit: NASA/Goddard Space Flight Center Scientific Visualization Studio. A special thanks to all those who contributed data and advice without which this product would not have been possible (in no particular order): Alexander Kosovichev (Stanford University), Todd Hoeksema (Stanford University), Steele Hill (L-3 Communications Analytics Corporation/GSFC), Brian R. Dennis (NASA/GSFC), Peter T. Gallagher (L-3 Communications Analytics Corporation/GSFC), Joseph B. Gurman (NASA/GSFC), Nathan Rich (Interferometrics Inc./NRL), Bernhard Fleck (NASA/GSFC), Craig DeForest (SwRI), Philip Scherrer (Stanford University)
Combined visualization of 3D magnetic field lines, and proton flux for energies above 50 MeV (the GOES 2nd channel) fopr the July 14, 2000 "Bastille Day" flare/CME.. The > 50 MeV flux is shown as color contours. The figure in the leftmost column display the low coronal portion (out to about 4RS) of the simulation, the middle frames display the corona to about 17RS, and the rightmost frame show the domain to 1 AU (the green sphere on the righthand edge of these images shows the Earth’s position.
Credit: Linker, Jon A. and Caplan, Ronald M., Schwadron, Nathan and Gorby, Matthew and Downs, Cooper and Torok, Tibor and Lionello, Roberto and Wijaya, Janvier, Coupled MHD-Focused Transport Simulations for Modeling Solar Particle Events, Journal of Physics Conference Series, 1225, 012007, 2019, doi = 10.1088/1742-6596/1225/1/012007
Enlil model of the 2019 April 20 CME propagating out to PSP. Left panels show modeled densities and right panels show the difference between the modeled density with the CME and the ambient density in the background solar wind. An animation is available. The video starts on 2019-04-01T02:01 and ends at 2019-05-01T00:02. The real-time video duration is 29 s.
Credit: Schwadron, N. A. et al., ApJS, in Press, 2019
Composite of the PSP/WISPR Inner and Outer cameras during the first solar encounter (Nov 2018). The location and relative size of the Sun is shown to scale, remaining just outside of the field of view and allowing WISPR to observe solar outflow and coronal mass ejections. Many stars, and the Milky Way, can be see crossing the images. Credit: Brendan Gallagher/Karl Battams/NRL
![This image, taken from [the movie above] highlights the location of the very faint dust trail we observe following Phaethon’s orbit. Credit: Brendan Gallagher/Karl Battams/NRL](/static/svs/images/no_preview_web_black.png)
This image, taken from [the movie above] highlights the location of the very faint dust trail we observe following Phaethon’s orbit. Credit: Brendan Gallagher/Karl Battams/NRL
The same image sequence as [above] but with additional processing to reduce the brightness of stars and enhance fainter features. Here we are able to see more clearly the very faint dust trail – the Geminds – following the orbit of asteroid (3200) Phaethon. Credit: Brendan Gallagher/Karl Battams/NRL
Credits
Please give credit for this item to:
NASA's Goddard Space Flight Center
-
Scientists
- Nicholeen Viall (NASA/GSFC)
- Timothy Horbury (Imperial College London)
- Kelly Korreck (Johns Hopkins University/APL)
- Nathan Schwadron (University of New Hampshire)
- Karl Battams (Naval Research Laboratory)
-
Science writer
- Sarah Frazier (ADNET Systems, Inc.)
-
Producer
- Genna Duberstein (USRA)
Release date
This page was originally published on Wednesday, December 11, 2019.
This page was last updated on Wednesday, May 3, 2023 at 1:45 PM EDT.
Missions
This visualization is related to the following missions:Related
- ID: 13282
 Produced Video
 - ID: 20299
 Animation