How NASA Will Protect Astronauts From Space Radiation
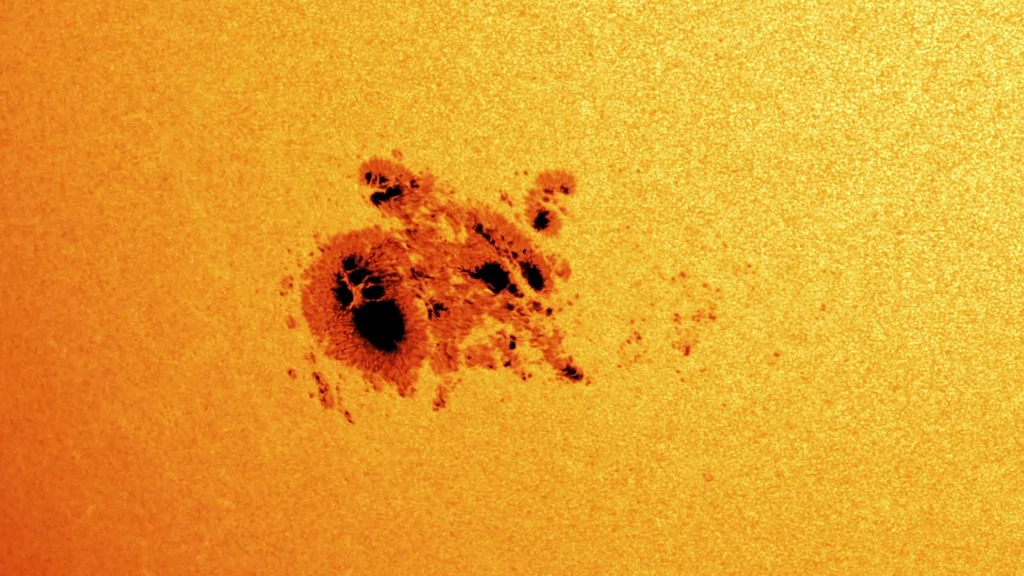
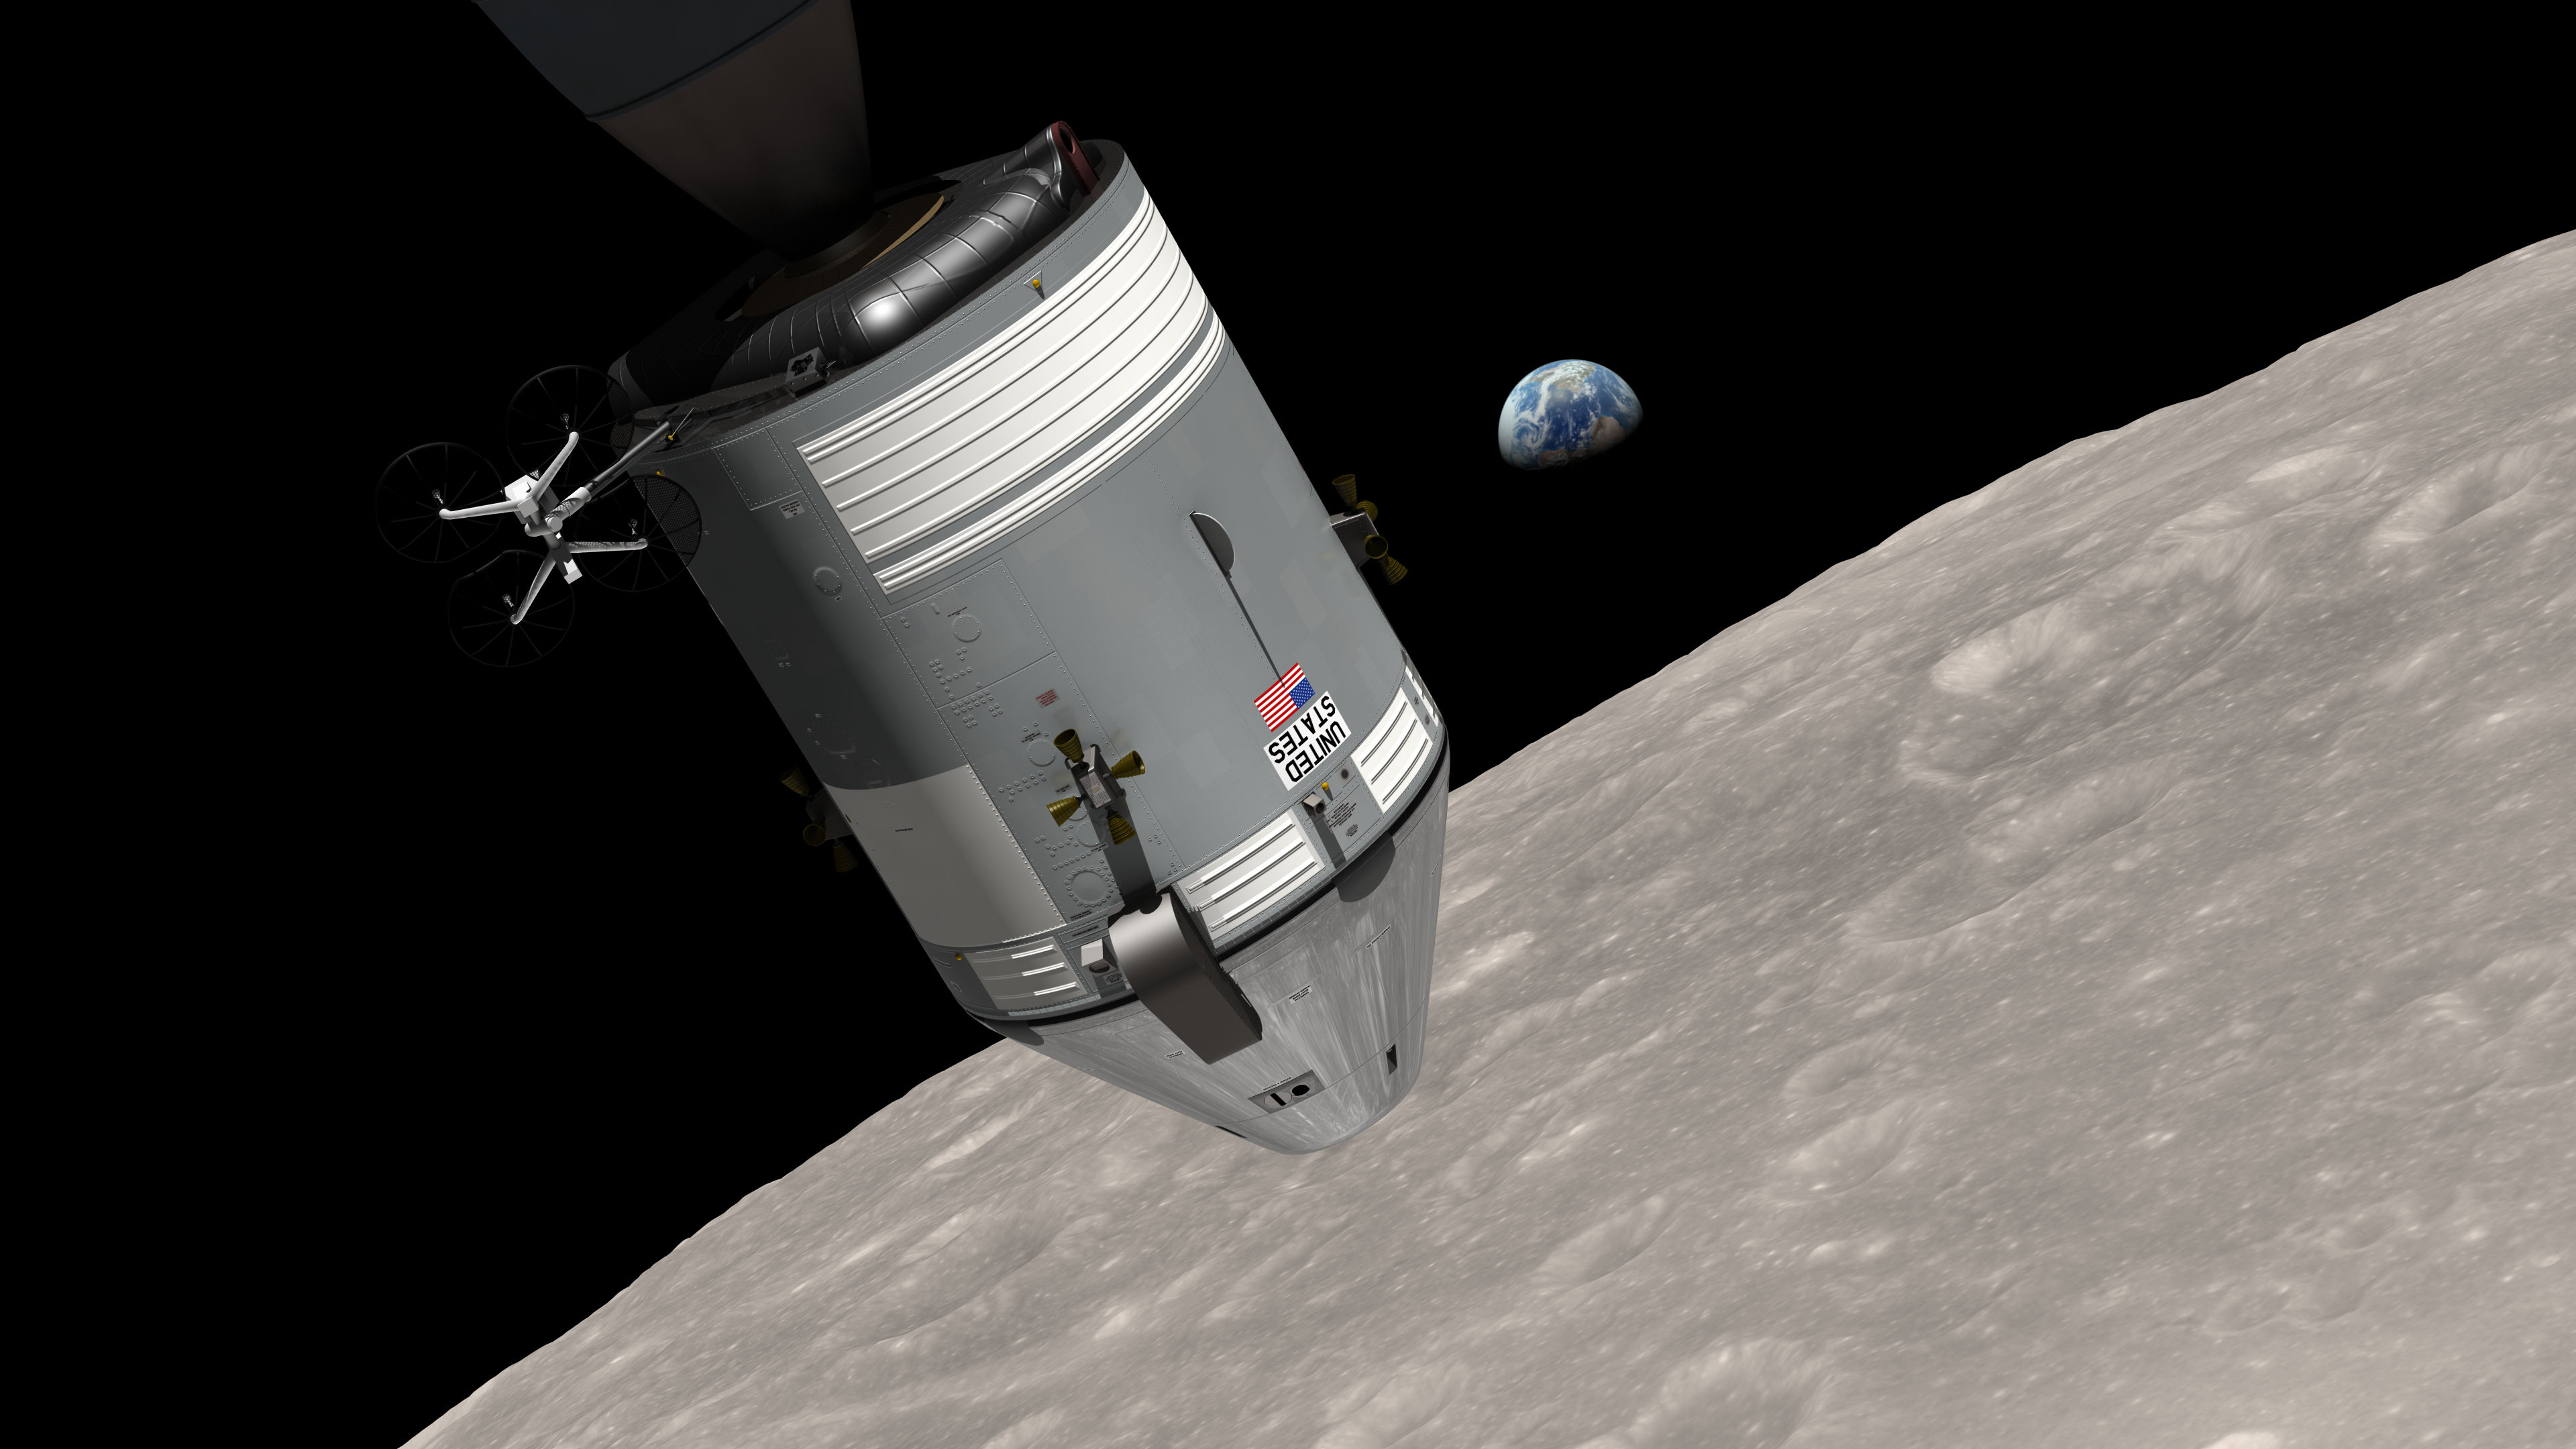
The same sunspots that disrupted the television signals led to enormous solar flares — powerful bursts of radiation from the Sun — Aug. 4-7 that year. Between the Apollo 16 and 17 missions, the solar eruptions were a near miss for lunar explorers. Had they been in orbit or on the Moon’s surface, they would have sustained dangerous levels of solar radiation sparked by the eruptions. Today, the Apollo-era flares serve as a reminder of the threat of radiation exposure for technology and astronauts in space. Understanding and predicting solar eruptions is crucial for safe space exploration.
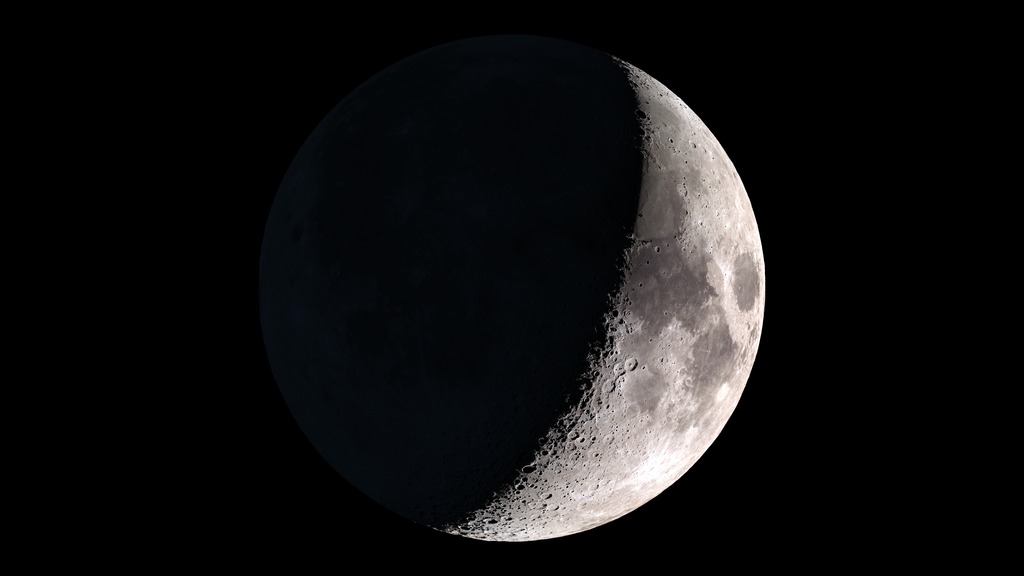
Almost 50 years since those 1972 storms, the data, technology and resources available to NASA have improved, enabling advancements towards space weather forecasts and astronaut protection — key to NASA’s Artemis program to return astronauts to the Moon.
Read more on NASA.gov.
Movies
- 13275_AstronautRadiation_Prores.mov (1920x1080) [5.3 GB]
- 13275_AstronautRadiation_YouTube.mp4 (1920x1080) [635.4 MB]
- 13275_AstronautRadiation_YouTube.webm (1920x1080) [43.6 MB]
- 13275_AstronautRadiation_Facebook.mp4 (1920x1080) [475.7 MB]
- 13275_AstronautRadiation_Twitter.mp4 (1920x1080) [86.1 MB]
Captions
- AstronautRadiation.en_US.srt [7.6 KB]
- AstronautRadiation.en_US.vtt [7.6 KB]
Images
- 13275_AstronautRadiation_Twitter.01205_print.jpg (1024x576) [54.8 KB]
- 13275_AstronautRadiation_Twitter.01205_thm.png (80x40) [5.8 KB]
- 13275_AstronautRadiation_Twitter.01205_searchweb.png (320x180) [65.5 KB]
- 13275_AstronautRadiation_Twitter.01205_web.png (320x180) [65.5 KB]
Watch this video on the NASA Goddard YouTube channel.
Complete transcript available.
Music credits: “Boreal Moment” by Benoit Scarwell [SACEM]; “Sensory Questioning”, “Natural Time Cycles”, “Emerging Designer”, and “Experimental Design” by Laurent Dury [SACEM]; “Superluminal” by Lee Groves [PRS], Peter George Marett [PRS] from Killer Tracks

GIF
Apollo 14 astronauts Alan Shepard and Edgar Mitchell prepare to plant the American flag on the Moon's surface.
Credit: NASA

GIF
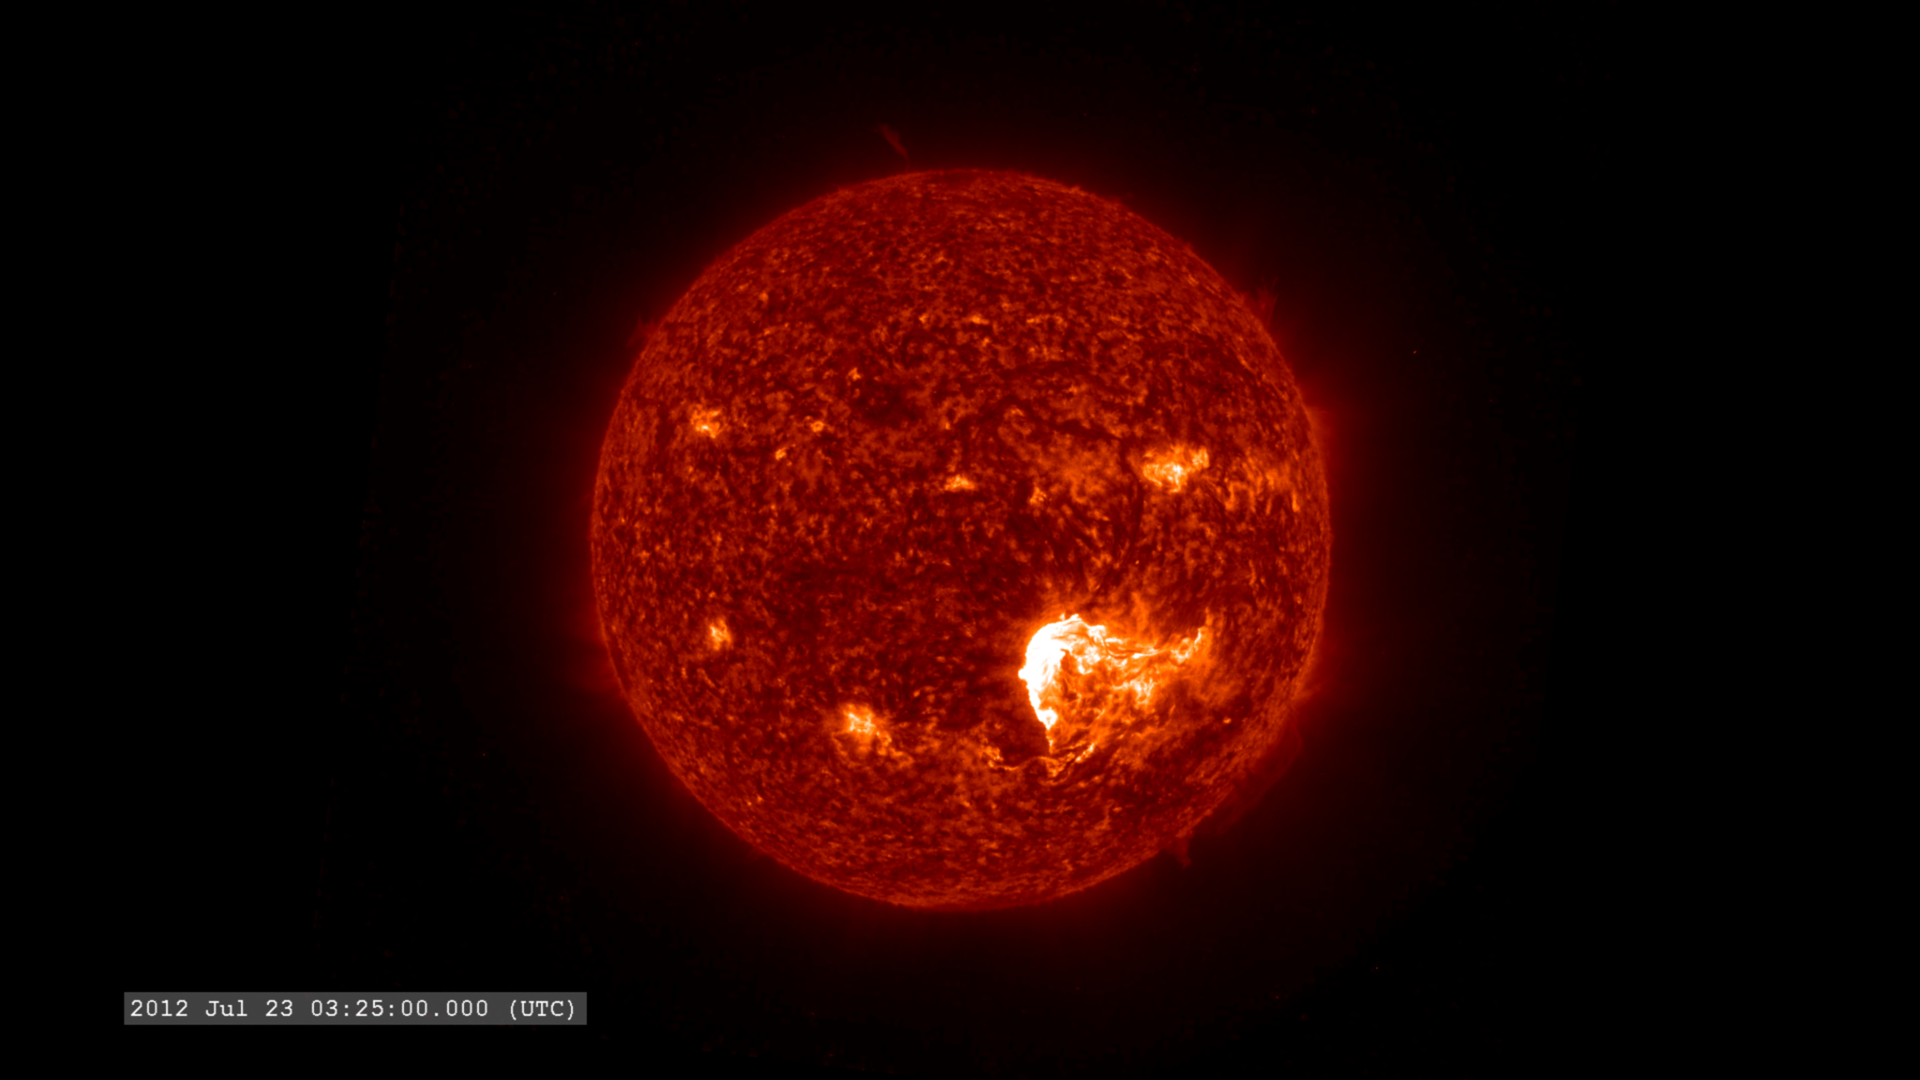
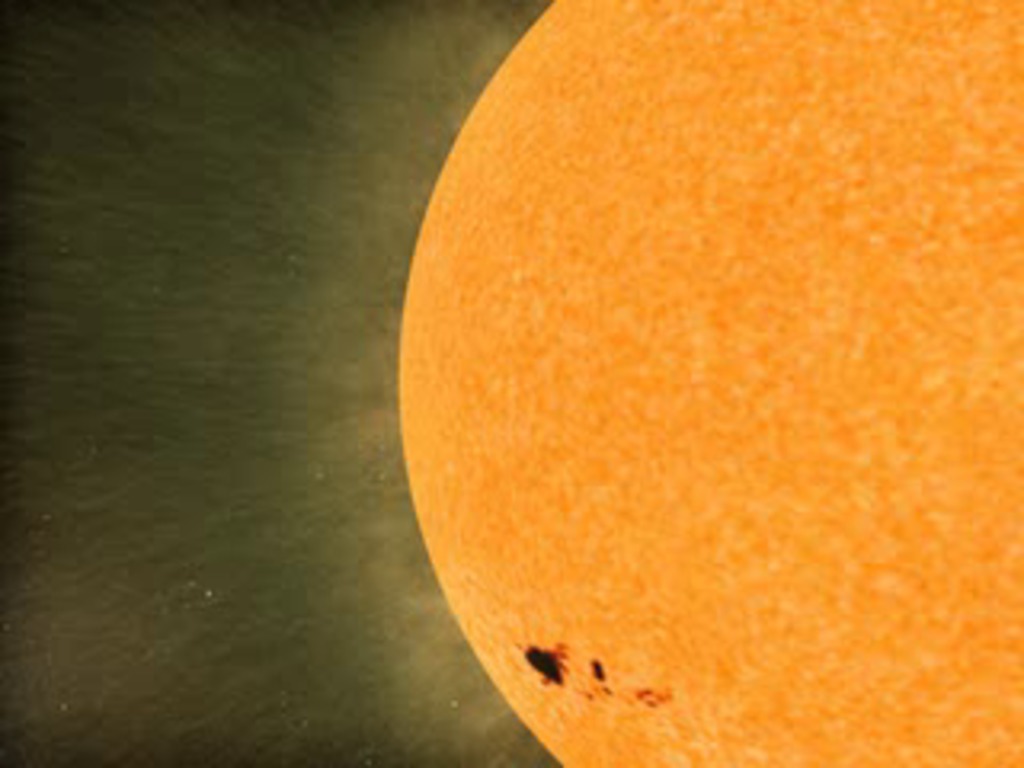
The Aug. 7, 1972, solar flare was captured by the Big Bear Solar Observatory in California. This particular flare — known as the seahorse flare for the shape of the bright regions — sparked a strong SEP event that could have been harmful to astronauts if an Apollo mission had been in progress at the time.
Credit: NASA

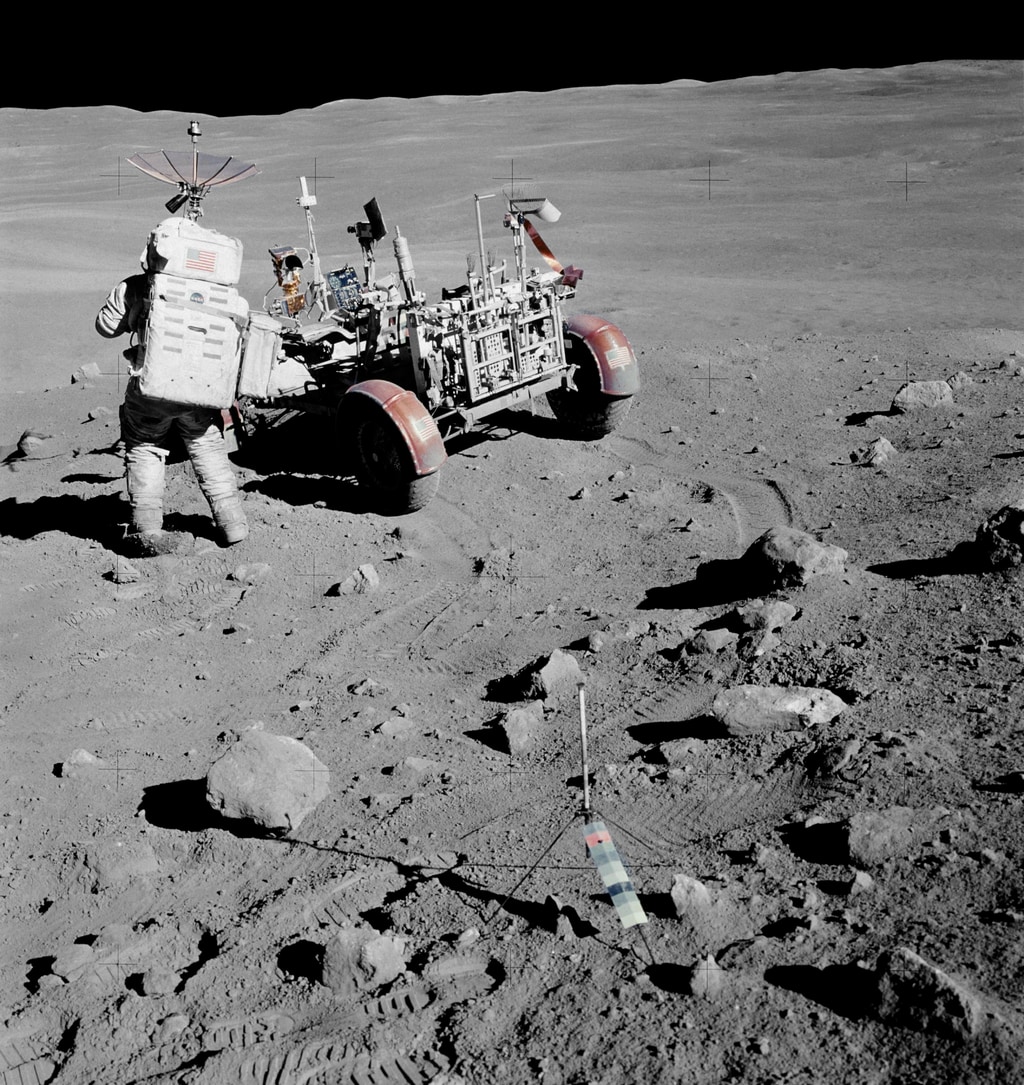
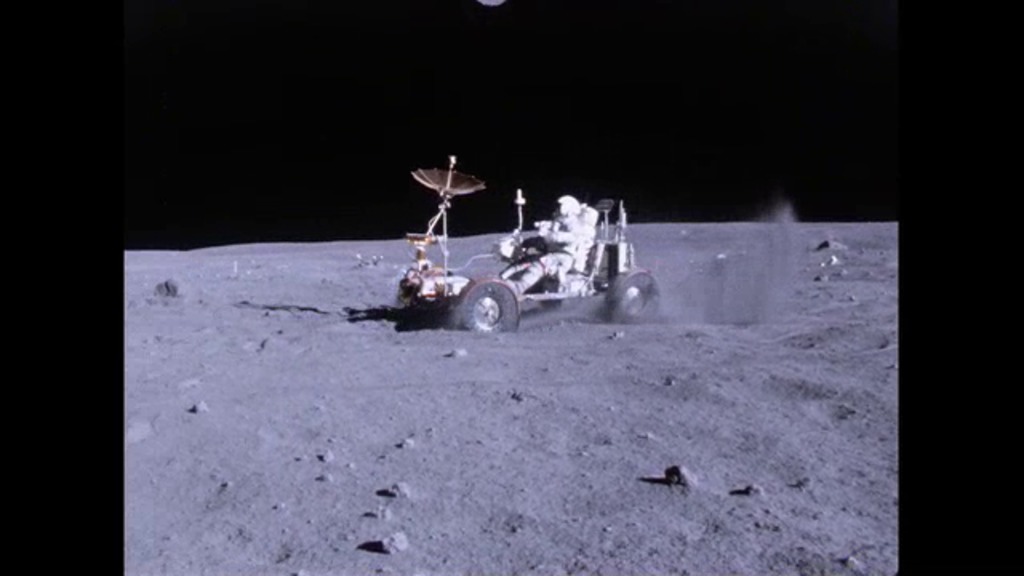
The lunar rover vehicle during the Apollo 16 mission in April 1972. The lunar roving vehicle -- which was developed by NASA’s Marshall Space Flight Center -- was used for collecting rocks and data on the lunar highlands.
Credit: NASA
1972Apollo 17Apollo MissionsAstronautBlackoutCCMCClimate IndicatorsCMECME shockCommunity Coordinated Modeling CenterCoronaCoronal Mass EjectionsCosmic RaysEarth ScienceflareGalactic Cosmic Rays
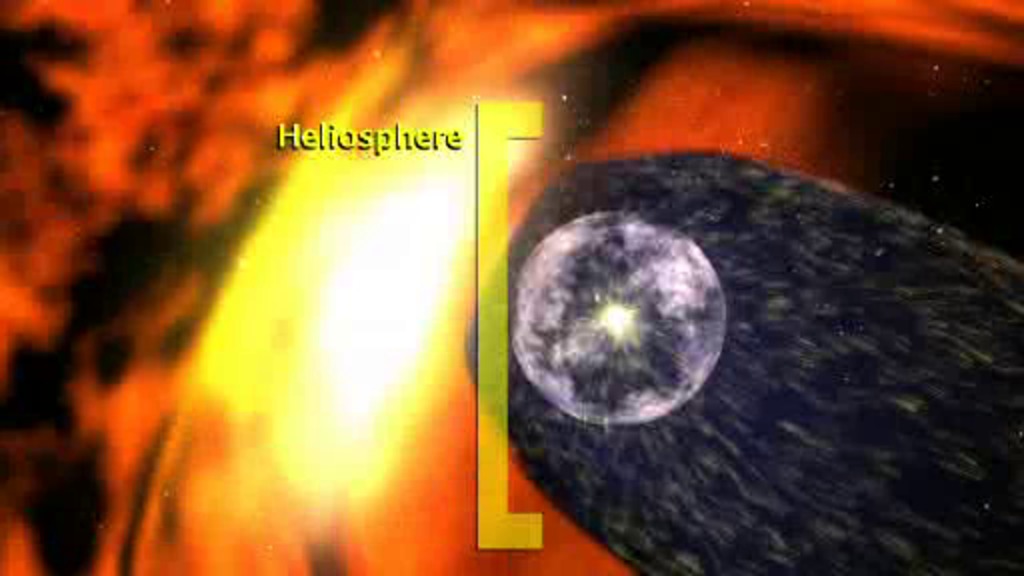
HeliophysicsHeliosphereHuman DimensionsHuman HealthHuman SpaceflightMagnetosphereMarsMoonorionParker Solar ProbePlasmaPublic HealthRadiationRadiation ExposureRadiation ProtectionRadiation SicknessSDOSEPsSOHOSolar ActivitySolar CycleSolar Dynamics ObservatorySolar Energetic Particle Fluxsolar energetic particlesSolar FlaresSolar Particle EventSolar WindSpace RadiationSpace TravelSpace WeatherSTEREOSun-earth InteractionsSunspot ActivitySunspot CycleSunspots
Credits
Please give credit for this item to:
NASA's Goddard Space Flight Center
Animators
- Brian Monroe (USRA)
- Greg Shirah (NASA/GSFC)
- Josh Masters (Freelance)
- Scott Wiessinger (KBRwyle)
- Tom Bridgman (GST)
- Walt Feimer (KBRwyle)
Writer
- Kathalina Tran (SGT)
Scientists
- Edward Semones (NASA/JSC)
- Eric Christian (NASA/HQ)
- Georgia De Nolfo (NASA/GSFC)
- Ian G. Richardson (University of Maryland, College Park)
- Kerry T. Lee (NASA/JSC)
- Noah Petro (NASA/GSFC)
- Ruthan Lewis (NASA/GSFC)
- Yaireska Collado-Vega (NASA/GSFC)
Producer
- Joy Ng (KBRwyle)
Cinematographers
- John Caldwell (AIMM)
- Joy Ng (KBRwyle)
- Rob Andreoli (AIMM)
Technical support
- Aaron E. Lepsch (ADNET)
Missions
This visualization is related to the following missions:Series
This visualization can be found in the following series:Related pages
Heliophysics Sentinels 2020 (Forecast Version)
March 1st, 2021
Read moreThis visualization presents orbits of the current heliophysics satellites covering the space near Earth, out to the Sun-Earth Lagrange point, L1, and finally a view of the current missions operating in the inner solar system. In addition to the NASA missions used in research for space weather (see 2020 Heliophysics Fleet) there are additional missions operated by NOAA used for space weather forecasting. As of spring 2020, here's a tour of the NASA and NOAA Heliophysics fleets from the near-Earth satellites out to the inner solar system.The satellite orbits are color coded for their observing program:Magenta: TIM (Thermosphere, Ionosphere, Mesosphere) observationsYellow: solar observations and imageryCyan: Geospace and magnetosphereViolet: Heliospheric observations Near-Earth Fleet:Hinode: Observes the Sun in multiple wavelengths up to x-rays. SVS pageTIMED: Studies the upper layers (40-110 miles up) of Earth's atmosphere. SVS pageICON: Works with GOLD on studies of the ionosphere.AIM: Images and measures noctilucent clouds. SVS pageIRIS: Interface Region Imaging Spectrograph is designed to take high-resolution spectra and images of the region between the solar photosphere and solar atmosphere. SVS pageSET: Space Environment Testbed exploring radiation-hardening technologiesGeosynchronous Fleet:GOES East & GOES West: The GOES satellites provide continuous imagery of Earth's western hemisphere and monitor the solar X-ray flux.SDO: Solar Dynamics Observatory keeps the Sun under continuous observation at 16 megapixel resolution. SVS pageGOLD: Global-scale Observations of the Limb and Disk is a spectroscopic imager for studying the ionosphere.Geospace Fleet:Geotail: Conducts measurements of electrons and ions in the Earth's magnetotail. SVS pageMagnetospheric Multi-scale (MMS): This is a group of four satellites which fly in formation to measure how particles and fields in the magnetosphere vary in space and time. SVS pageTHEMIS: This is a fleet of three satellites to study how magnetospheric instabilities produce substorms. Two of the original five satellites were moved into lunar orbit to become THEMIS-ARTEMIS. SVS page IBEX: The Interstellar Boundary Explorer measures the flux of neutral atoms from the heliopause. SVS pageLunar Orbiting Fleet:THEMIS-ARTEMIS: Two of the THEMIS satellites were moved into lunar orbit to study the interaction of the Earth's magnetosphere with the Moon. SVS pageSun-Earth Lagrange Point One Fleet:The L1 point is a Lagrange Point between the Sun and the Earth. Spacecraft can orbit this location for continuous coverage of the Sun.DSCOVR: Observes Earth and measures the solar wind.SOHO: Studies the Sun with cameras and a multitude of other instruments. SVS pageACE: Measures the composition and characteristics of the solar wind. SVS pageWind: Measures particle flows and fields in the solar wind. SVS pageSolar Orbiting Fleet:STEREO-A: The remaining STEREO spaceraft orbits the Sun in roughly the same orbit as Earth. SVS pageParker Solar Probe: On an orbit that takes it closer to the Sun than any other mission. SVS pageSolar Orbiter: On an orbit that takes it to high solar latitudes. SVS page For More InformationSee [NASA.gov](https://www.nasa.gov/mission_pages/sunearth/missions/index.html) Related pages
Heliophysics Sentinels 2020
Sept. 15th, 2020
Read moreThis visualization presents orbits of the current heliophysics satellites covering the space near Earth, out to the orbit of the Moon. This visualization presents orbits of the current heliophysics satellites covering the space near Earth, out to the Moon and then to the Sun-Earth Lagrange point, L1. This visualization presents orbits of the current heliophysics satellites covering the space near Earth, out to the Sun-Earth Lagrange point, L1, and finally a view of the current missions operating in the inner solar system. This visualization presents orbits of the current heliophysics satellites covering the space near Earth, through the solar system, and concluding with a view of the Voyagers, just outside the heliopause. There have been few changes since the 2018 Heliophysics Fleet. Van Allen Probes and SORCE have been decommissioned, while Solar Orbiter, ICON and SET have been added. As of spring 2020, here's a tour of the NASA Heliophysics fleet from the near-Earth satellites out to the Voyagers beyond the heliopause.Excepting the Voyager missions, the satellite orbits are color coded for their observing program:Magenta: TIM (Thermosphere, Ionosphere, Mesosphere) observationsYellow: solar observations and imageryCyan: Geospace and magnetosphereViolet: Heliospheric observations Near-Earth Fleet:Hinode: Observes the Sun in multiple wavelengths up to x-rays. SVS pageTIMED: Studies the upper layers (40-110 miles up) of Earth's atmosphere. SVS pageICON: Works with GOLD on studies of the ionosphere.AIM: Images and measures noctilucent clouds. SVS pageIRIS: Interface Region Imaging Spectrograph is designed to take high-resolution spectra and images of the region between the solar photosphere and solar atmosphere. SVS pageSET: Space Environment Testbed exploring radiation-hardening technologiesGeosynchronous Fleet:SDO: Solar Dynamics Observatory keeps the Sun under continuous observation at 16 megapixel resolution. SVS pageGOLD: Global-scale Observations of the Limb and Disk is a spectroscopic imager for studying the ionosphere.Geospace Fleet:Geotail: Conducts measurements of electrons and ions in the Earth's magnetotail. SVS pageMagnetospheric Multi-scale (MMS): This is a group of four satellites which fly in formation to measure how particles and fields in the magnetosphere vary in space and time. SVS pageTHEMIS: This is a fleet of three satellites to study how magnetospheric instabilities produce substorms. Two of the original five satellites were moved into lunar orbit to become THEMIS-ARTEMIS. SVS page IBEX: The Interstellar Boundary Explorer measures the flux of neutral atoms from the heliopause. SVS pageLunar Orbiting Fleet:THEMIS-ARTEMIS: Two of the THEMIS satellites were moved into lunar orbit to study the interaction of the Earth's magnetosphere with the Moon. SVS page Sun-Earth Lagrange Point One Fleet:The L1 point is a Lagrange Point between the Sun and the Earth. Spacecraft can orbit this location for continuous coverage of the Sun.SOHO: Studies the Sun with cameras and a multitude of other instruments. SVS pageACE: Measures the composition and characteristics of the solar wind. SVS pageWind: Measures particle flows and fields in the solar wind. SVS page Solar Orbiting Fleet:STEREO-A: The remaining STEREO spaceraft orbits the Sun in roughly the same orbit as Earth. SVS pageParker Solar Probe: On an orbit that takes it closer to the Sun than any other mission. SVS pageSolar Orbiter: On an orbit that takes it to high solar latitudes. SVS page Interstellar Fleet:Voyager 1 & Voyager 2: The two Voyager spaceraft orbit originally performed flybys of the outer planets of the solar system but continued to operate. They are now the most distant monitors of the plasma in the space between the stars. At the time of this visualization, Voyager 2 has just crossed the heliopause.SVS page For More InformationSee [NASA.gov](https://www.nasa.gov/mission_pages/sunearth/missions/index.html) Related pages
Heliophysics Sentinels 2018
Dec. 10th, 2018
Read moreThis movie presents the trajectories of the heliophysics fleet from close to Earth to out beyond the heliopause. The near-Earth, geosynchronous, and geospace missions. The fleet at the Earth-Sun L1 point. The inner solar orbiting fleet. The Voyagers at and beyond the heliopause. There have been few changes since the 2017 Earth-Orbiting Heliophysics Fleet. RHESSI, TWINS, and STEREO-B have been decommissioned, while GOLD and Parker Solar Probe have been added. As of fall 2018, here's a tour of the NASA Heliophysics fleet from the near-Earth satellites out to the Voyagers beyond the heliopause.The satellite orbits are color coded for their observing program:Magenta: TIM (Thermosphere, Ionosphere, Mesosphere) observationsYellow: solar observations and imageryCyan: Geospace and magnetosphereViolet: Heliospheric observations Near-Earth Fleet:Hinode: Observes the Sun in multiple wavelengths up to x-rays. SVS pageTIMED: Studies the upper layers (40-110 miles up) of Earth's atmosphere. SVS pageSORCE: Monitors solar intensity across a broad range of the electromagnetic spectrum.AIM: Images and measures noctilucent clouds. SVS pageVan Allen Probes: Two probes moving along the same orbit designed to study the impact of space weather on Earth's radiation belts. SVS pageIRIS: Interface Region Imaging Spectrograph is designed to take high-resolution spectra and images of the region between the solar photosphere and solar atmosphere. SVS pageGeosynchronous Fleet:SDO: Solar Dynamics Observatory keeps the Sun under continuous observation at 16 megapixel resolution. SVS pageGOLD: Global-scale Observations of the Limb and Disk is a spectroscopic imager for studying the ionosphere.Geospace Fleet:Geotail: Conducts measurements of electrons and ions in the Earth's magnetotail. SVS pageMagnetospheric Multi-scale (MMS): This is a group of four satellites which fly in formation to measure how particles and fields in the magnetosphere vary in space and time. SVS pageTHEMIS: This is a fleet of three satellites to study how magnetospheric instabilities produce substorms. Two of the original five satellites were moved into lunar orbit to become ARTEMIS. SVS page IBEX: The Interstellar Boundary Explorer measures the flux of neutral atoms from the heliopause. SVS page Lunar Orbiting Fleet:ARTEMIS: Two of the THEMIS satellites were moved into lunar orbit to study the interaction of the Earth's magnetosphere with the Moon. SVS pageSun-Earth Lagrange Point One Fleet:The L1 point is a Lagrange Point between the Sun and the Earth. Spacecraft can orbit this location for continuous coverage of the Sun.SOHO: Studies the Sun with cameras and a multitude of other instruments. SVS pageACE: Measures the composition and characteristics of the solar wind. SVS pageWind: Measures particle flows and fields in the solar wind. SVS page Solar Orbiting Fleet:STEREO-A: The remaining STEREO spaceraft orbits the Sun in roughly the same orbit as Earth. SVS pageParker Solar Probe: On an orbit that takes it closer to the Sun than any other mission. SVS page Interstellar Fleet:Voyager 1 & Voyager 2: The two Voyager spaceraft orbit originally performed flybys of the outer planets of the solar system but continued to operate. They are now the most distant monitors of the plasma in the space between the stars. At the time of this visualization, Voyager 2 has just crossed the heliopause.SVS page Related pages
Apollo 17 Landing Site
Dec. 8th, 2015
Read moreVisualization of the Moon as viewed from Earth at the time of the Apollo 17 Moon landing, December 11, 1972 at 19:55 UTC. Visualization of the Moon as viewed from the Earth at the time of the Apollo 17 return launch (when the LM left the surface of the Moon), December 14, 1972 at 22:55 UTC. A flyover visualization of the Taurus-Littrow Valley looking due west, with the Sun angle at the time of the Apollo 17 landing. This uses a 32-degree square inset of LOLA data at 512 points per degree (roughly 60 meters per pixel). An oblique image of the Taurus-Littrow valley taken by the LRO narrow-angle camera. This was cropped from M192703697LR. The Apollo 17 LM descent stage shadow is precisely centered in the image. The resolution is about 4 meters per pixel. A nadir view of the Apollo 17 landing site taken by the LRO narrow-angle camera. West is up, north is to the right. The early morning Sun angle is similar to the lighting at the time of the landing. The resolution is about 0.48 meters per pixel. This is part of M162107606L. A reverse-angle oblique view of Taurus-Littrow taken July 7, 2012, cropped and scaled from M1096343661. Looking east (slew angle 56°) with afternoon Sun (subsolar longitude 48°W). A full resolution detail from the reverse-angle view of Taurus-Littrow, centered on the LM descent stage. The horizontal resolution is roughly 0.75 meters per pixel. At Station 6, the astronauts collected samples from a boulder that had rolled down the side of the North Massif. The LROC image is a detail from M134991788R. See also this LROC featured image blog post. Panoramic image of the landing site. Another oblique image (M1182232465LE) of the Taurus-Littrow valley taken by the LRO narrow-angle camera on March 29, 2015. A nadir view of the Apollo 17 landing site derived from a mosaic of LRO narrow-angle camera images. West is up, north is to the right. The LM descent stage is centered horizontally and about two-thirds of the way down (y = 1983 pixels). AS17-134-20430, a panoramic view of the North Massif from Station 1, taken during the first EVA. Radar image mosaic of Taurus-Littrow from LRO's Mini-RF instrument. Missing data has been filled in with data from an LROC NAC frame. Apollo 17, crewed by Eugene Cernan, Ronald Evans, and Harrison Schmitt, was the final Apollo mission to the Moon. The Lunar Module Challenger landed in the Taurus-Littrow valley on December 11, 1972 and remained there for 75 hours. The landing site is a relatively flat spot among low mountains at the southeastern edge of Mare Serenitatis.The images here are designed for display on NASA's hyperwall. They help tell the story of Apollo 17's exploration of the Taurus-Littrow site using data and imaging from Lunar Reconnaissance Orbiter (LRO) and photographs taken by the astronauts. LRO's detailed and comprehensive remote sensing capabilities have fostered a reinterpretation of the geology of the site. Related pages
Earthrise in 4K
Dec. 21st, 2018
Read moreOn December 24, 1968, Apollo 8 astronauts Frank Borman, Jim Lovell, and Bill Anders became the first humans to witness the Earth rising above the moon's barren surface. Now we can relive the astronauts' experience, thanks to data from NASA's Lunar Reconnaissance Orbiter. Complete transcript available.Watch this video on the NASA Goddard YouTube channel. Two craters visible in the Earthrise image, formerly called Pasteur T and Ganskiy M, were renamed Anders' Earthrise and 8 Homeward by the International Astronomical Union to commemorate the 50th anniversary of the Apollo 8 mission. This is a new, ultra-high definition (UHD, or 4K) version of the Earthrise visualization first published in 2013.In December of 1968, the crew of Apollo 8 became the first people to leave our home planet and travel to another body in space. But as crew members Frank Borman, James Lovell, and William Anders all later recalled, the most important thing they discovered was Earth.Using photo mosaics and elevation data from Lunar Reconnaissance Orbiter (LRO), this video commemorates Apollo 8's historic flight by recreating the moment when the crew first saw and photographed the Earth rising from behind the Moon. Narrator Andrew Chaikin, author of A Man on the Moon, sets the scene for a three-minute visualization of the view from both inside and outside the spacecraft accompanied by the onboard audio of the astronauts.The visualization draws on numerous historical sources, including the actual cloud pattern on Earth from the ESSA-7 satellite and dozens of photographs taken by Apollo 8, and it reveals new, historically significant information about the Earthrise photographs. It has not been widely known, for example, that the spacecraft was rolling when the photos were taken, and that it was this roll that brought the Earth into view. The visualization establishes the precise timing of the roll and, for the first time ever, identifies which window each photograph was taken from. Related pages
Apollo 8 - 50th Anniversary Montage
Dec. 19th, 2018
Read moreMusic: "People Can't Stop Chillin'" by Sports (@sportsband)Complete transcript available. This video is a montage of NASA archival footage from the Apollo 8 mission.Youtube: https://youtu.be/1LZ0gPZf7nk Related pages
The CME Heard 'Round the Solar System
Nov. 30th, 2018
Read moreAs the CMEs and SIRs move through the solar system, we include graphs of particle fluxes measured at Earth, Mars, and STEREO-A. First frame of the visualization, illustrating regions of high temperature (red), high particle density (green), and the stream interaction region (SIR, blue). Color bar representing changes in plasma density, in atomic mass units (AMU) per cubic centimeter. This is roughly equal to the number of hydrogen ions per cubic centimeter. Color bar representing the plasma temperature. Energetic events at the Sun can reverberate around the solar system.This visualization combines data from particle detectors around the solar system with an Enlil simulation of multiple coronal mass ejections (CMEs) in early September 2017. The Enlil model extends from 0.1 astronomical units (AUs) from the Sun (this is reponsible for the empty region around the Sun at the center of the system) out to 5 AUs.Stream Interaction Regions (SIRs) are created by the interaction at boundaries between the fast and slow solar wind (usually defined by coronal holes). In this model, they are represented by blue spirals streaming out from the sun at the center.Active Region 12673 erupted with several X-class flares and CMEs on September 9-10, 2017. The initial CME was slow (500 km/s) and the subsequent CMEs were faster (1000 km/s and 2600 km/s, respectively). Eventually the CMEs merged together and continued outward.At Earth, the particle detector on GOES detects the initial flare. The energetic proton flux decays with time and has a sharper decrease as the CME and SIR pass Earth.The initial flare is also detected at Mars by Mars EXpress, after which the flux declines. The flux experiences an additional sharp drop as the CME passes Mars.There is a small flux increase at STEREO-A at the time of the flare. However, the flux increases dramatically as the SIR passes, then slowly decays. Related pages
Parker Solar Probe
July 30th, 2018
Read moreNASA's mission to touch the Sun begins its journey in 2018 Explore the mysteries of the Sun that Parker Solar Probe will seek to answer. Learn why Parker Solar Probe won't melt when it flies through the Sun's corona. The solar wind is a constant stream of charged particles that emanate from the Sun and affect all the planets in the solar system. Parker Solar Probe uses remote and direct measurements to collect data about the Sun. Parker Solar Probe was designed and built at the Johns Hopkins University Applied Physics Laboratory. Related pages
Parker Solar Probe Science Briefing - Visual Resources
July 20th, 2018
Read moreTrailer without text introduction. Music credit: Luminous Skies [Underscore] by Andrew Prahlow from www.killertracks.comComplete transcript available.Watch this video on the NASA Goddard YouTube channel. Image of Parker Solar Probe. Credit: APL/NASA GSFC Beauty pass animation of Parker Solar Probe in the solar wind. Credit: NASA GSFC/CIL/Brian Monroe Animation of the solar wind. Credit: NASA GSFC/CIL/Krystofer Kim Photo of Eugene Parker. Credit: University of Chicago Animation of a coronal mass ejection (CME) from the Sun. Credit: NASA GSFC/CIL/Krystofer Kim Animation of a spacecraft being damaged by space weather. Credit: NASA GSFC/CIL/Krystofer Kim Graphic illustrating the layers of the Sun. Credit: NASA GSFC/Mary Pat Hrybyk-Keith Animation of Parker Solar Probe during a Venus flyby. Credit: Johns Hopkins University/APL/Steve Gribben Animation of Parker Solar Probe's trajectory. Credit: Johns Hopkins University/APL/Steve Gribben Animation of Parker Solar Probe approaching the Sun. Credit: Johns Hopkins University/APL/Steve Gribben Graphic identifying the solar limb sensors on Parker Solar Probe. The sensors help the spacecraft stay oriented behind its protective shield. Credit: NASA/APL Engineer Patrick Hill (Johns Hopkins APL) gives a tour of the Parker Solar Probes's systems. Credit: NASA/Johns Hopkins APL/Lee HobsonComplete transcript available. July 20, 2018 - Live from NASA Kennedy - 1:00 p.m. ESTHosted by Karen Fox - Heliophysics Communications Lead, NASA Goddard/NASA HQSpeakers:Nicola Fox - Parker Solar Probe Project Scientist, The Johns Hopkins University Applied Physics LabAlex Young - Solar Scientist from NASA GoddardThomas Zurbuchen - Associate Administrator for the Science Mission Directorate at NASABetsy Congdon - Thermal Protection System Engineer at The Johns Hopkins University Applied Physics Lab Related pages
NASA and ESA Spacecraft Track a Solar Storm Through Space
Aug. 15th, 2017
Read moreThis animation follows the October 14, 2014 CME as it moves through the solar system and identifies a few of the NASA and ESA missions that observed it.Music: “Comely" from FelicityWritten and produced by Lars LeonhardWatch this video on the NASA.gov Video YouTube channel.Complete transcript available. Animated gif of ENLIL model at 4AU and 10AU distances October 14, 2014 ENLIL model out to 4AU distance. October 14, 2014 ENLIL model out to 10AU distance. October 14, 2014 ENLIL model out to 35AU distance. While we track CMEs with a number of instruments, the sheer size of the solar system means that our observations are limited, and usually taken from a distance. However, scientists have recently used data from ten NASA and ESA spacecraft in the direct path of a CME to piece together an unprecedented portrait of how these solar storms move through space – in particular, narrowing down the changes in speed that happen as CMEs travel through the solar system beyond Earth's orbit.On Oct. 14, 2014, a CME left the Sun, as measured by spacecraft that watch for CMEs from afar using an instrument called a coronagraph. From there, the CME washed over spacecraft throughout the inner solar system – including by Curiosity on Mars, near comet 67P/Churyumov-Gerasimenko, and out to Saturn. This wealth of data is a boon for scientists working on space science simulations. At NASA’s Goddard Space Flight Center in Greenbelt, Maryland, scientists work to validate, host, and improve such simulations, and this new information provides the most comprehensive look to date at how the speed of a CME evolves over time. CMEs like this are common, especially when the Sun is in an active phase, as it was in 2014. This particular CME first caught scientists’ interest because of its interference with another set of observations: the interaction between Comet Siding Spring and the Martian atmosphere. After scientists realized that comet 67P – and therefore ESA’s Rosetta spacecraft, then orbiting the comet – was lined up to be right in the path of the CME, too, they began hunting for other observations. This added up to seven direct, confirmed detections of the CME. ESA’s Venus Express also measured the CME indirectly, and two additional NASA spacecraft had probable detections of the CME as well – a few months and then over a year after it burst from the Sun. New Horizons on its way to Pluto very likely observed this same CME in January 2015, and Voyager 2 on the edge of the heliosphere may have observed it in March 2016. But because of Voyager 2’s great distance from the Sun and New Horizon’s lack of a magnetometer – an instrument that measures magnetic fields – it’s not possible to say for certain if the particle changes detected by those spacecraft were caused by this particular CME. For More InformationSee [https://www.nasa.gov/feature/goddard/2017/nasa-esa-spacecraft-track-solar-storm-through-space](https://www.nasa.gov/feature/goddard/2017/nasa-esa-spacecraft-track-solar-storm-through-space) Related pages
Sunspot Live Shots 2014
Nov. 19th, 2014
Read moreCanned interviews for Sunspot live shot 11/20/2014 Canned interviews for Sunspot live shot 11/20/2014 B-roll associated with Sunspot Live Shot. A large sunspot capable of producing major solar activity is facing Earth this week, leaving scientists wondering what it will do. This sunspot was the largest in 24 years when it faced Earth last month. Although the sunspot has shrunk since then, it still has the potential to produce significant space weather that could affect us here on Earth. For More InformationSee [www.nasa.gov/sunearth](www.nasa.gov/sunearth) Related pages
As Seen by STEREO-A: The Carrington-Class CME of 2012
July 22nd, 2014
Read moreA bright flare erupts from an active region in this image from STEREO-A 304 angstrom ultraviolet filter. The resulting coronal mass ejection (CME) erupts in a 'halo' form, suggesting the CME could be heading away from, or toward, the STEREO-A spacecraft. This image is a combination of the EUVI 304 angstrom images and the STEREO-A COR2 coronagraph. In this composite of EUVI 304 angstrom, COR2 and the Heliospheric Imager-1 (HI-1), we see particle hits of solar protons and other heavy ions striking the CCD and also appearing in the HI-1 imager. In this composite of EUVI 304 angstrom, COR-2 and the Heliospheric Imager-1 (HI-1), we see the CME expanding in COR-2. The planet Mercury is labeled. The other bright objected in HI-1, below the line between Mercury and the sun, is the star Antares in the constellation Scorpius. A bright flare erupts in an active region in this image from STEREO-A 195 angstrom ultraviolet filter. A bright flare erupts from an active region in this image from STEREO-A 304 angstrom ultraviolet filter. Long version. The resulting coronal mass ejection (CME) erupts in a 'halo' form, suggesting the CME could be heading away from, or toward, the STEREO-A spacecraft. This image is a combination of the EUVI 304 angstrom images and the STEREO-A COR2 coronagraph. Long version. In this composite of EUVI 304 angstrom, COR2 and the Heliospheric Imager-1 (HI-1), we see particle hits of solar protons and other heavy ions striking the CCD and also appearing in the HI-1 imager. Long version. In this composite of EUVI 304 angstrom, COR-2 and the Heliospheric Imager-1 (HI-1), we see the CME expanding in COR-2. The planet Mercury is labeled. The other bright objected in HI-1, below the line between Mercury and the sun, is the star Antares in the constellation Scorpius. Long version. STEREO-A, at a position along Earth's orbit where it has an unobstructed view of the far side of the Sun, could clearly observe possibly the most powerful coronal mass ejection (CME) of solar cyle 24 on July 23, 2012. The visualizations on this page cover the entire day.We see the flare erupt in the lower right quadrant of the solar disk from a large active region. The material is launched into space in a direction towards STEREO-A. This creates the ring-like 'halo' CME visible in the STEREO-A coronagraph, COR-2 (blue circular image).As the CME expands beyond the field of view of the COR-2 imager, the high energy particles reach STEREO-A, creating the snow-like noise in the image. The particles also strike the HI-2 imager (blue square) brightening the image.The HI-1 imager has had 'bloom removal' enabled and filled with contents of the immediately previous HI-1 image, which creates a linear artifact above and below bright stars and planets. For More InformationSee [Science@NASA](http://science.nasa.gov/science-news/science-at-nasa/2014/23jul_superstorm/) Related pages
Excerpt from "Dynamic Earth"
June 18th, 2012
Read moreFollow a coronal mass ejection as is passes Venus then Earth, and explore how the sun drives Earth's winds and oceans.For complete transcript, click here.Also available for the entire Dynamic Earth show are the transcript and the educator's guide. A coronal mass ejection erupts from the Sun. A coronal mass ejection approaches Venus. A coronal mass ejection passes Venus. Ocean currents of the Gulf Stream. Ocean currents beneath the Gulf Stream. The loop current feeds into the Gulf Stream. Follow a coronal mass ejection as is passes Venus then Earth; and explore how the sun drive Earth's winds and oceans. This version has an alternate narrator.For complete transcript, click here. Unnarrated, edited version with just the Sun to Earth coronal mass ejection (with a Venus flyby). The entire sequence, unnarrated and formatted for the Hyperwall. Starting from the coronal mass ejection and formatted for the Hyperwall. Shows the coronal mass ejection only, and formatted for the Hyperwall. Shows the wind flows only, and formatted for the Hyperwall. A giant explosion of magnetic energy from the sun, called a coronal mass ejection, slams into and is deflected completely by the Earth's powerful magnetic field. The sun also continually sends out streams of light and radiation energy. Earth's atmosphere acts like a radiation shield, blocking quite a bit of this energy.Much of the radiation energy that makes it through is reflected back into space by clouds, ice and snow and the energy that remains helps to drive the Earth system, powering a remarkable planetary engine — the climate. It becomes the energy that feeds swirling wind and ocean currents as cold air and surface waters move toward the equator and warm air and water moves toward the poles — all in an attempt to equalize temperatures around the world.A jury appointed by the National Science Foundation (NSF) and Science magazine has selected "Excerpt from Dynamic Earth" as the winner of the 2013 NSF International Science and Engineering Visualization Challenge for the Video category. This animation will be highlighted in the February 2014 special section of Science and will be hosted on ScienceMag.org and NSF.govThis animation was selected for the Computer Animation Festival's Electronic Theater at the Association for Computer Machinery's Special Interest Group on Computer Graphics and Interactive Techniques (SIGGRAPH), a prestigious computer graphics and technical research forum. This is an excerpt from the fulldome, high-resolution show 'Dynamic Earth: Exploring Earth's Climate Engine.' The Dynamic Earth dome show was selected as a finalist in the Jackson Hole Wildlife Film Festival Science Media Awards under the category "Best Immersive Cinema - Fulldome". For More InformationSee [http://www.nasa.gov/topics/earth/features/dynamic-earth.html](http://www.nasa.gov/topics/earth/features/dynamic-earth.html) Related pages
Cosmic Rays and the Heliopause
Oct. 1st, 2010
Read moreCosmic ray flux animation This animation shows how variations in the size of the heliosphere affect how many cosmic rays reach Earth. As the heliosphere expands, it blocks more cosmic rays, and as it contracts, more cosmic rays get through and can affect astronauts and satellites. Related pages
Introduction to the Heliopause
Sept. 21st, 2010
Read moreWhat is the heliopause?For complete transcript, click here. What NASA missions investigate the heliopause?For complete transcript, click here. What are we learning about the edge of the solar system?For complete transcript, click here. What are the consequences of this new knowledge to our understanding of the heliosphere?For complete transcript, click here. What are the consequences in other fields?For complete transcript, click here. What do we expect to learn from the heliosphere in the next couple of years?For complete transcript, click here. Dr. Merav Opher talks about the heliopause, the distant region where the solar wind collides with the interstellar medium. She is an astrophysicist and an associate professor of physics and astronomy at George Mason University. These short videos were produced for the Sun-Earth Connection Education Forum and the Space Weather Media Viewer. The Space Weather Media Viewer is an application built to support Education and Public Outreach activities of NASA. Many of the images that appear in this viewer are "near-real time" and come from a variety of NASA Missions. Related pages
Apollo Mission Lunar Surface Footage
May 4th, 2009
Read moreThis footage give a glimpse of what it's like to set foot on the surface of the moon. In this iconic NASA footage, astronauts climb down from the lunar lander and plant an American flag on the lunar surface. All Apollo footage is part of the media collection at Johnson Space Center in Houston. To obtain more historical footage from manned spaceflight missions, contact JSC's Media Resource Center at (281) 483-4231. Related pages
Solar Energetic Particles and CMEs
Sept. 19th, 2007
Read moreSolar Energetic particles This animation shows a CME erupting off of the Sun and the energetic particles racing ahead of the CME and how they react with the Earth's magnetic field and Mars' magnetic field. Related pages
Lee Lincoln Scarp at the Apollo 17 Landing Site
May 13th, 2019
Read moreAn animated view of Lee Lincoln scarp from above and from near ground level. This visualization is created from Lunar Reconnaissance Orbiter photographs and elevation mapping. The scarp is at the western end of the Taurus-Littrow valley, landing site of Apollo 17, and was explored by the astronauts on their second moonwalk. An animated view of Lee Lincoln scarp from above and from near ground level. This visualization is created from Lunar Reconnaissance Orbiter photographs and elevation mapping. The scarp is at the western end of the Taurus-Littrow valley, landing site of Apollo 17, and was explored by the astronauts on their second moonwalk. Music by Killer Tracks: Smoke and Mirrors - Gresby Race Nash.This video is also available on the NASA Goddard YouTube channel. The Lee Lincoln scarp is a low ridge or step about 80 meters high and running north-south through the western end of the Taurus-Littrow valley, site of the Apollo 17 Moon landing. This lobate scarp marks the location of a relatively young, low-angle thrust fault. The land west of the fault was forced up and over the eastern side as the lunar crust contracted.In a May 2019 paper published in Nature Geoscience, Thomas Watters and his coauthors provide evidence that this fault and others like it are still active and producing moonquakes today. Seismometers left on the Moon by Apollo astronauts recorded hundreds of events between 1969 and 1977, including 28 shallow moonquakes. The study narrowed the locations of these quakes and found that many of them occurred near scarps, implying that the forces creating the scarps also caused the quakes, and they continue to shape the lunar surface. The Lee Lincoln scarp was only about 13 kilometers from one of the epicenters identified by the scientists.The Apollo 17 astronauts drove their lunar rover onto the scarp during their second day on the lunar surface, and this remains the only extraterrestrial scarp visited by humans. For More InformationSee [Shrinking Moon May Be Generating Moonquakes](https://www.nasa.gov/press-release/goddard/2019/moonquakes) Related pages