A Drier Future Sets the Stage for More Wildfires
- Written by:
- Jessica Merzdorf
- Produced by:
- LK Ward
- View full credits
Movies
- DroughtsFires_V2.mov (1920x1080)
- DroughtsFires_V2.mp4 (1920x1080)
- DroughtsFires_V2.webm (1920x1080)
Images
- Camp_Fire_oli_2018312_Landsat.jpg (3017x2011)
- Camp_Fire_oli_2018312_Landsat_thm.png (80x40)
- Camp_Fire_oli_2018312_Landsat_searchweb.png (320x180)
Right click movies to download them if they automatically play in your browser.
Music: Motion Blur by Sam Dodson, Spring Into Life by Oliver Worth, and Critical Pathway by Rik Carter.
Complete transcript available.
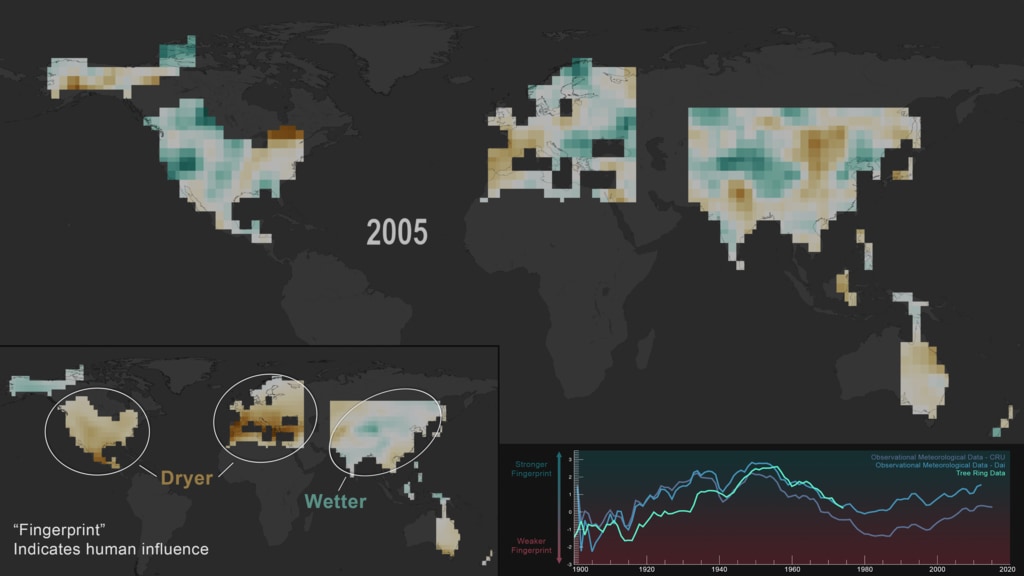
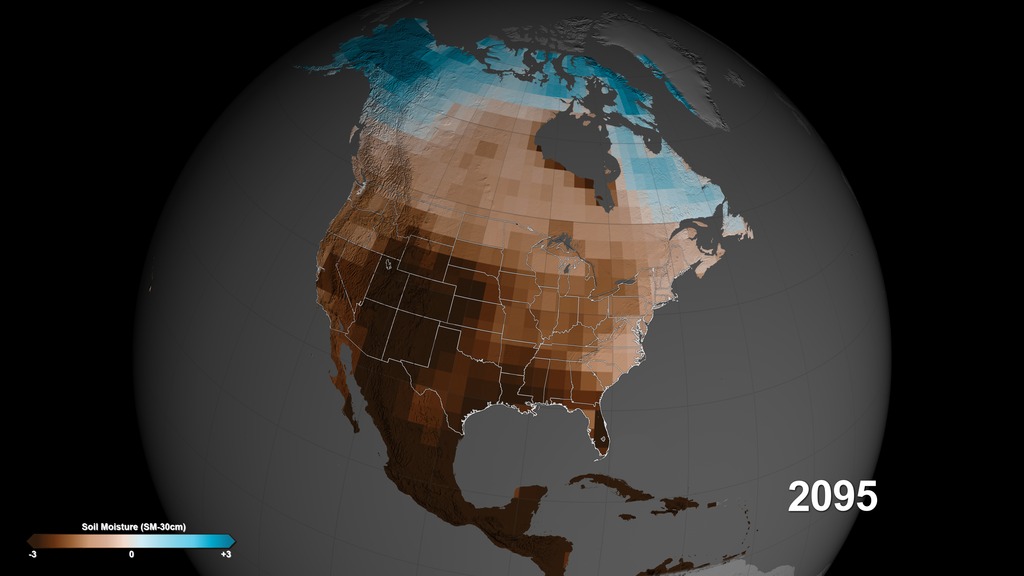
Credits
Please give credit for this item to:
NASA's Goddard Space Flight Center
Visualizers
- Cindy Starr (GST)
- Greg Shirah (NASA/GSFC)
- Kel Elkins (USRA)
Writer
- Jessica Merzdorf (Telophase) [Lead]
Scientists
- Ben Cook (NASA/GSFC)
- Kate Marvel (NASA/GSFC GISS)
Producer
- LK Ward (KBRwyle) [Lead]
Technical support
- Aaron E. Lepsch (ADNET)
Series
This visualization can be found in the following series:Related pages
New NASA Campaign Tracks Wildfire Smoke for Improved Air Quality Forecasts Live Shots
Aug. 6, 2019, 2:05 a.m.
Read moreNew NASA Campaign Tracks Wildfire Smoke for Improved Air Quality ForecastsRecord-Breaking Heat Conditions Set the Stage for Hotter and Longer Fires AheadThis summer, fires have raged through hundreds of thousands of acres across North America, polluting the air we breathe. The smoke from these wildfires can even cross the Atlantic Ocean and travel around the globe. This summer, NASA researchers are in the field taking on the most comprehensive campaign in the continental United States to investigate fast-traveling wildfire smoke to improve air quality forecasting. Click here for link to this feature in SpanishThis past June was the warmest June on record, and early data indicates that July of 2019 was the hottest month ever recorded. These hotter and drier conditions set the stage for more intense wildfires that can bring dangerous smoke to a city near you.Chat with NASA scientists on Thursday, August 8 from 6:00 a.m. to 12:00 p.m. EST to find out more about what NASA is doing to track smoke and its impact on your local community.From its unique vantage point in space, NASA serves as one of the first fire detectors. With NASA’s latest satellite technology, we can help firefighters and forest managers combat fires by tracking wildfire movement and impact in real-time.*** To schedule an interview, please fill out THIS FORM.***Location for interviews is NASA’s Goddard Space Flight Center in Greenbelt, Maryland. satellite coordinatesHD Satellite Coordinates for G17-K17/Lower: Galaxy 17 Ku-band Xp 17 Slot Lower| 91.0 ° W Longitude | DL 12031.0 MHz | Horizontal Polarity | QPSK/DVB-S | FEC 3/4 | SR 13.235 Mbps | DR 18.2954 MHz | HD 720p | Format MPEG2 | Chroma Level 4:2:0 | Audio Embedded *** Questions? Contact isabelle.c.yan@nasa.gov or 301-286-2470. B-roll for the following suggested questions:1. We all know NASA as a space agency. How can NASA’s unique perspective inform us about wildfires?2. NASA researchers are in the field right now tracking smoke from wildfires. What are they seeing from the air and ground?3. This June was the hottest June on record, with early data pointing to July being the warmest month on record. What impact has that had on this year’s fire season?4. When you think of wildfires, you usually associate that with the western part of the U.S. How can wildfires affect us throughout the world?5. How does a changing planet contribute to longer and hotter wildfires?6. Where can people learn more?Click here for on-camera canned interviewsClick here for audio interviews and NAT sound Canned interview with Dr. Doug Morton/ NASA Scientist Click download button for audio file.Scientist Dr. Doug Morton talks about how NASA keeps an eye on wildfires from space. TRT 1:39 Click download button for audio file.Scientist Dr. Doug Morton talks about how NASA keeps an eye on wildfires from space. TRT :23 Click download button for audio file.The DC-8, the largest plane participating in the FIREX-AQ campaign, is tasked with flying through smoke from wildfires to capture data on as many as 500 chemicals in a single plume. Listen as the DC-8 takes off for its 6-hour flight over a wildfire burning in Idaho. Canned interview with NASA Scientist Dr. Elizabeth Hoy. Answers are separated by slates. TRT 3:43 Canned interview with NASA Scientist Dr. Elizabeth Hoy talking about wildfires in Alaska and how NASA is studying those wildfires with its ABoVE mission. Answers are separate by a second of black. TRT 1:56 For More InformationSee [https://www.nasa.gov/topics/earth/index.html](https://www.nasa.gov/topics/earth/index.html)
Using Tree Rings to Study Human Influence on Hydroclimate
Dec. 13, 2018, 7 p.m.
Read moreHuman-generated greenhouse gases and atmospheric particles were affecting global drought risk as far back as the early 20th century, according to a study from NASA’s Goddard Institute for Space Studies (GISS) in New York City. The study compared real-world data with climate models, which predicted that human influences could be seen early in the 1900’s and would increase. To the researchers’ surprise, clear evidence of a human “fingerprint” — a global drought pattern more likely to occur if greenhouse gases are affecting the climate — emerged within the first half of the last century. While the study included various human and natural influences, the only one that consistently increased across the century and the globe was greenhouse gases, suggesting they drove the fingerprint. The study is the first to provide historical evidence connecting human-generated emissions and drought, suggesting that forward-looking climate models are accurately predicting future drought conditions and that humans play a key role in their location and severity, the team said. This visualization displays a global drought atlas dating back to 1400, created using data from tree rings. The data is displayed on a flat rectangular map projection with a simple overlay depicting the differences in tree ring sizes for dry and wet years. In the second half of the visualization, a ‘fingerprint’ thumbnail is introduced, which is an indicator for human influences on climate change. A signal-to-noise ratio graph is depicted comparing the fingerprint to both tree ring drought atlas data and observational meteorological data (CRU and Dai) Global ‘drought atlas’ data derived from tree rings running from 1400-2005. Green is wetter and brown is dryer. No titles. Note that the timing of the frames slows during the years 1900-2005. This graphic describes how thicker tree rings indicate a wet year, and thinner tree rings indicate dry years “Fingerprint” still image depicting a global pattern of drought more likely to occur if greenhouse gasses are affecting the climate This graph represents the signal-to-noise ratio of the fingerprint against tree ring drought atlas and observational meteorological data “Fingerprint” still image depicting a global pattern of drought more likely to occur if greenhouse gasses are affecting the climate. This version has no labels These are the corresponding dates for the Global ‘drought atlas’ visualization above
Megadroughts in U.S. West Projected to be Worst of the Millennium
Feb. 12, 2015, 8:30 a.m.
Read moreDroughts in the Southwest and Central Plains of the United States in the second half of the 21st century could be drier and longer than anything humans have seen in those regions in the last 1,000 years, according to a new NASA study published in Science Advances on Feb 12, 2015. The research found continued increases in human-produced greenhouse gas emissions drives up the risk of severe droughts in these regions. lon: [-180, -50] and lat: [9.5, 74.5] )
How do we know for sure about Atmospheric Aerosols?
Dec. 13, 2021, 7 p.m.
Read moreThe Aerosol Robotic Network (AERONET) is one of the first places that scientists turn when volcanoes, wildfires, pollution plumes, dust storms and many other phenomena-both natural and manmade-make an appearance. The network of ground-based instruments, called sun photometers, measures the many tiny particles blowing about in the atmosphere called aerosols. The particles are often impossible to see with human eyes, but AERONET s processes at the 2021 United Nations Climate Change Conference. Also available on YouTube This visualization by Dr. Bill Putman shows the global distribution of aerosols, generated by NASA’s GEOS-FP data assimilation system, from August 1, 2019 to January 14,2020. Different aerosol species are highlighted by color, including dust (orange), sea-salt (blue), nitrates (pink), sulfates (green), and carbon (red), with brighter regions corresponding to higher aerosol amounts. More information is available about this animation at https://svs.gsfc.nasa.gov/31100 Fire and smoke and the African AERONET Team in Africa. AERONET in Europe. The map shows red dots for every European AERONET observation site. European AERONET sites The 7 Seas AERONET sites. The map shows red dots for every observation installation in this region. Images of the team of scientists from the AERONET installations in the 7 Seas region. AERONET in the Japanese Alps. Topography changes the transport of aerosols and these direct measurements help scientists understand how aerosols move in high and low elevations. AERONET installation in South America. Rapid deforestation of the Amazon makes these measurements taken in South America even more critical to understanding the role global aerosols have on our planet. AERONET helps the science community understand the role clouds play in our climate system. Fire and smoke AERONET can detect unhealthy air quality Video footage to support a NASA campaign to tracks wildfire smoke for improved Air Quality. More information is available about this at https://svs.gsfc.nasa.gov/13263 AERONET is only possible because of the cooperative efforts of the global AERONET community. Here are some of the people that make this data possible.From Clockwise, Beijing, Lille, Boulder, Valladolid, Greenbelt (GSFC). The photo above the Beijing group was contributed by Sharon J. Anderson, a story teller, taken at sunrise on Tuesday Oct. 5 on the Beltsville farm.
What NASA Knows from Decades of Earth System Observations
Dec. 12, 2021, 7 p.m.
Read moreNASA has the world’s largest Earth observing fleet and has an uninterrupted record and observed evidence of climate change. Increased greenhouse gases trap heat in the Earth’s atmosphere.Trapped atmospheric greenhouse gases warm the planet – our land, ocean, and atmosphere. Most of the global warming goes into the ocean, delaying the full impact of global warming. Ocean currents move the heat around the globe, impacting your local weather and climate. Warmer oceans accelerate melting of ice sheets in Greenland and Antarctica. Rising seas are a major consequence of climate change, impacting coastal communities, infrastructure, and economy. Warmer climate amplifies Earth’s water cycle. Dry areas are getting drier and wet areas are getting wetter. Wet areas are experiencing more flooding and extreme storms, such as typhoons and hurricanes. Drought prone areas will see less rainfall, effecting agriculture. NASA data are used for projections that can help inform actions for the future. More extreme conditions are occurring due to climate change, such as wildfires. NASA data and knowledge are open and free, enabling informed decision-making. NASA information aids preparation and recovery from natural hazards around the world Karen St. Germain, NASA 3, Sentinel-6MF NASA data are used for projections that can help inform actions for the future. Here is an example of yield projections from wheat and maize. Source is Jaegermeyer et al. 2021 CMIP6, AgMIP, NASA Goddard. NASA Informs Actionable Climate Decision MakingNASA information aids preparation and recovery from natural hazards around the world like tracking fires at https://firms.modaps.eosdis.nasa.gov/ Since 1993, NASA has continuously been measuring Sea Level Height of the global oceans. NASA data and knowledge are open and free, enabling informed decision-makingExample: planning for sea level rise on 10-100 year horizons at your coastal cityhttps://sealevel.nasa.gov (also at UNFCCC)