2018 Was the Fourth Hottest Year on Record
2018 was the fourth hottest year in the modern record, part of a decades-long trend of warming. The record dates back to 1880, when it became possible to collect consistent, reliable temperatures around the planet. NASA and NOAA work together to track the temperatures, part of ongoing research into our warming planet.

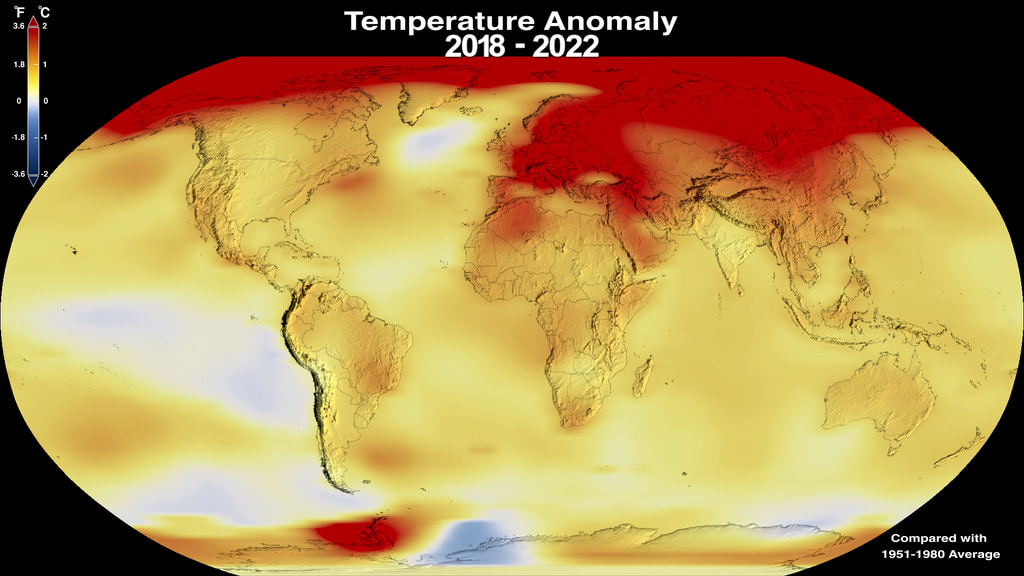
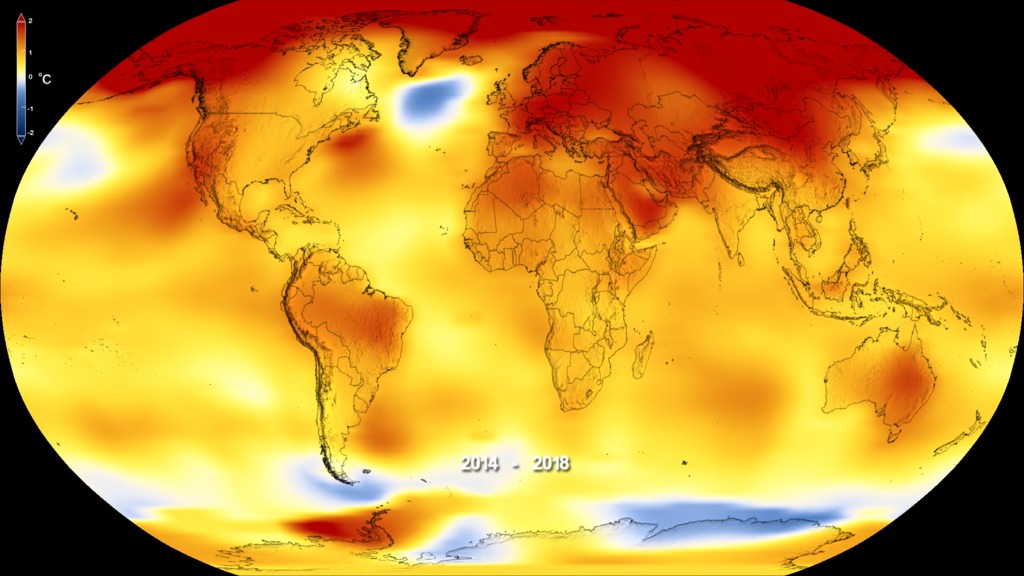
This color-coded map shows global surface temperature anomalies. Higher than normal temperatures are shown in red and lower than normal temperatures are shown in blue.
2018 was the fourth warmest year on record, part of a decades-long warming trend.
In 2018, the temperature was 1.5 degrees Fahrenheit warmer than the average from 1951 to 1980.
The measurement is a global average, so some places felt record high temperatures, while others were near average or even cooler.
This animated figure shows the seasonal cycle in global temperature anomalies for every month since 1880. Each line shows how much the global monthly temperature was above or below the annual global mean from 1980–2015. The column on the right lists each year when a new global temperature record was set. These seasonal anomalies are drawn from the Modern-Era Retrospective analysis for Research and Applications, version 2 (MERRA-2) model run by NASA’s Global Modeling and Assimilation Office.
Credit; NASA Earth Observatory/Joshua Stevens

This line plot shows yearly temperature anomalies from 1880 to 2018, with respect to the 1951-1980 mean, as recorded by NASA, NOAA, the Japan Meteorological Agency, the Berkeley Earth research group, and the Met Office Hadley Centre (UK). Though there are minor variations from year to year, all five temperature records show peaks and valleys in sync with each other. All show rapid warming in the past few decades, and all show the past decade has been the warmest.
Credit: NASA Earth Observatory/Joshua Stevens
Credits
Please give credit for this item to:
NASA's Goddard Space Flight Center
-
Producer
- Kathryn Mersmann (USRA)
-
Writer
- Ellen T. Gray (ADNET Systems, Inc.)
-
Public affairs officer
- Patrick Lynch (NASA/GSFC)
-
Scientist
- Gavin A. Schmidt (NASA/GSFC GISS)
Release date
This page was originally published on Wednesday, February 6, 2019.
This page was last updated on Wednesday, May 3, 2023 at 1:46 PM EDT.
Series
This visualization can be found in the following series:Related
- ID: 13516
![Music: Avalanches by Chris Constantinou [PRS] and Paul Frazer [PRS]Complete transcript available.](/vis/a010000/a013500/a013516/2019Temp.png) Produced Video
Produced Video
Sources
- ID: 5060
 Visualization
 - ID: 4964
 Visualization
 - ID: 4882
 Visualization
 - ID: 4787
 Visualization
 - ID: 4626
 Visualization