Predicting Landslides
- Visualizations by:
- Helen-Nicole Kostis
- Written by:
- Kasha Patel
- Scientific consulting by:
- Dalia B Kirschbaum and
- Thomas A. Stanley
- Produced by:
- Joy Ng and
- Ryan Fitzgibbons
- View full credits

Images
- ClimatologyJanuary_Cover_16x9_1024x576.jpg (1024x576) [96.2 KB]
- ClimatologyJanuary_Cover_16x9_1024x576_print.jpg (1024x576) [57.3 KB]
- ClimatologyJanuary_Cover_16x9.png (1280x720) [966.0 KB]
- ClimatologyJanuary_Cover_16x9_1024x576_thm.png (80x40) [4.4 KB]
- ClimatologyJanuary_Cover_16x9_1024x576_searchweb.png (320x180) [53.8 KB]
When the rain falls, the land slides.
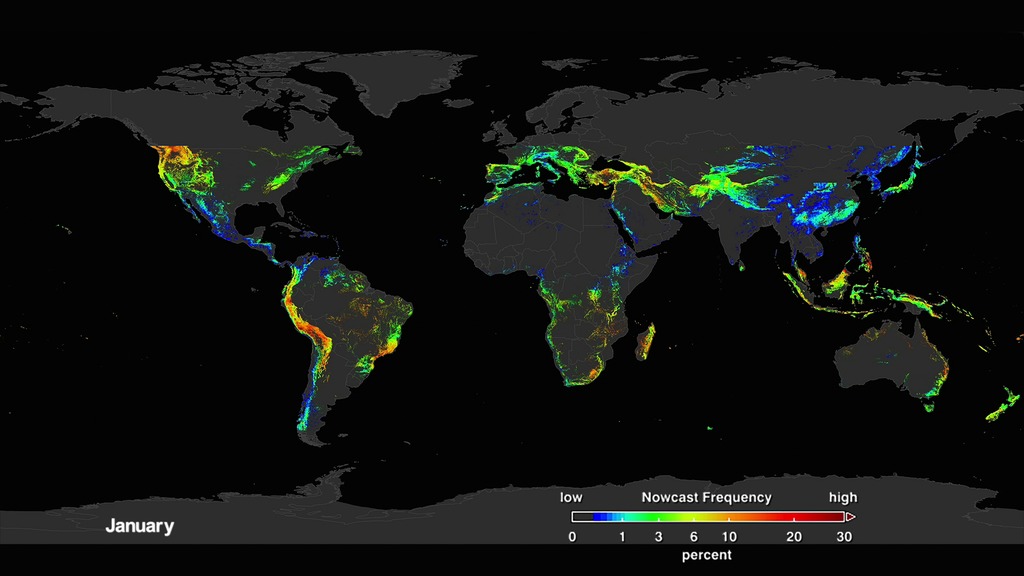
Learn how the Landslide Hazard Assessment model for Situational Awareness tracks potential landslide activity over time.
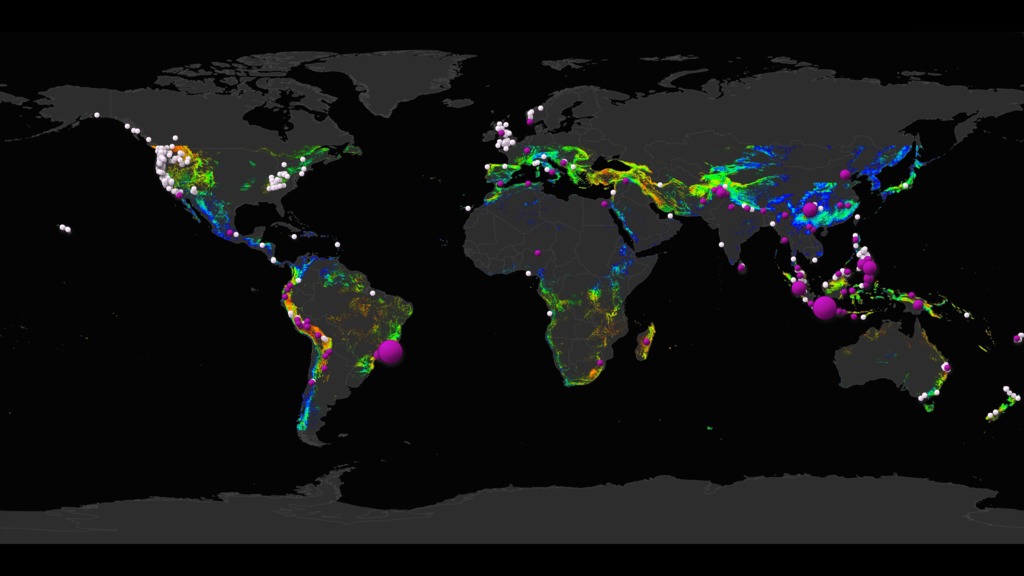
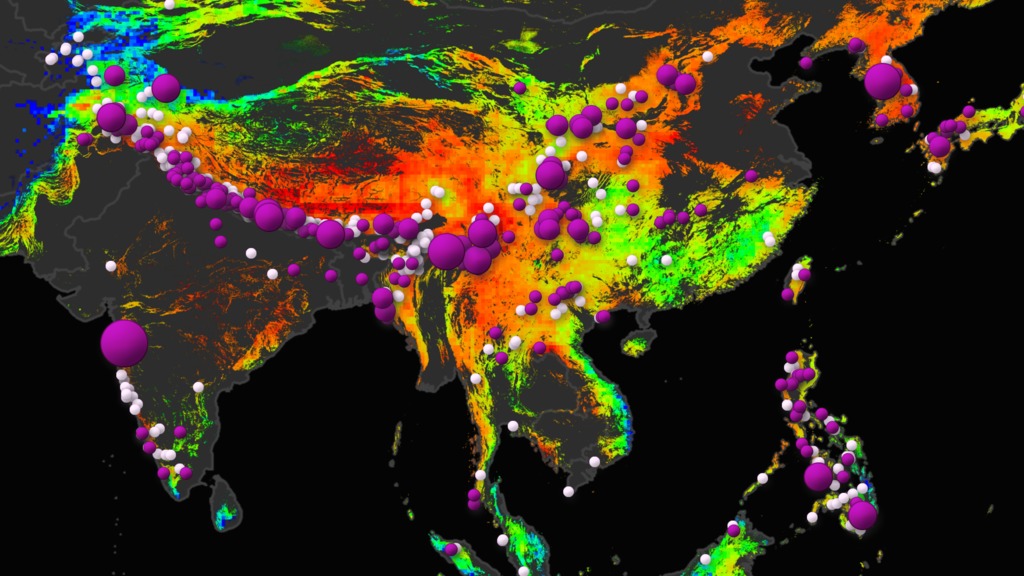
Each month's potential landslides are shown in blue to red, with purple dots indicating reported landslide fatalities.

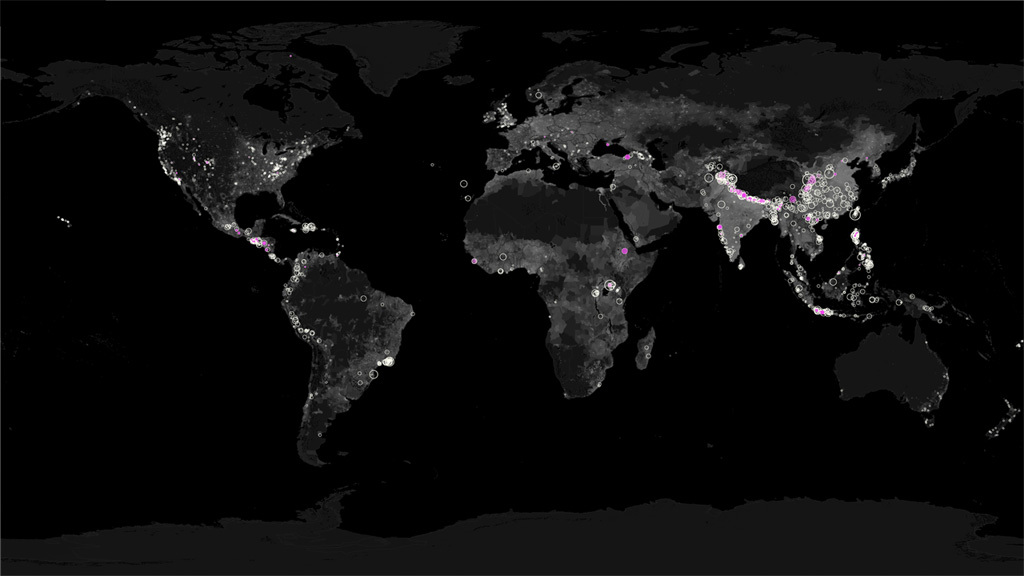
The purple dots show the distribution of fatalities between 2007 and 2018 that are related to rain-fall triggered landslides.

White dots show where a landslide occurred between 2007 and 2018 but with zero fatalities.

Southeast Asia’s potential landslide activity in any given July shows high risk areas (red) associated with reported fatalities.

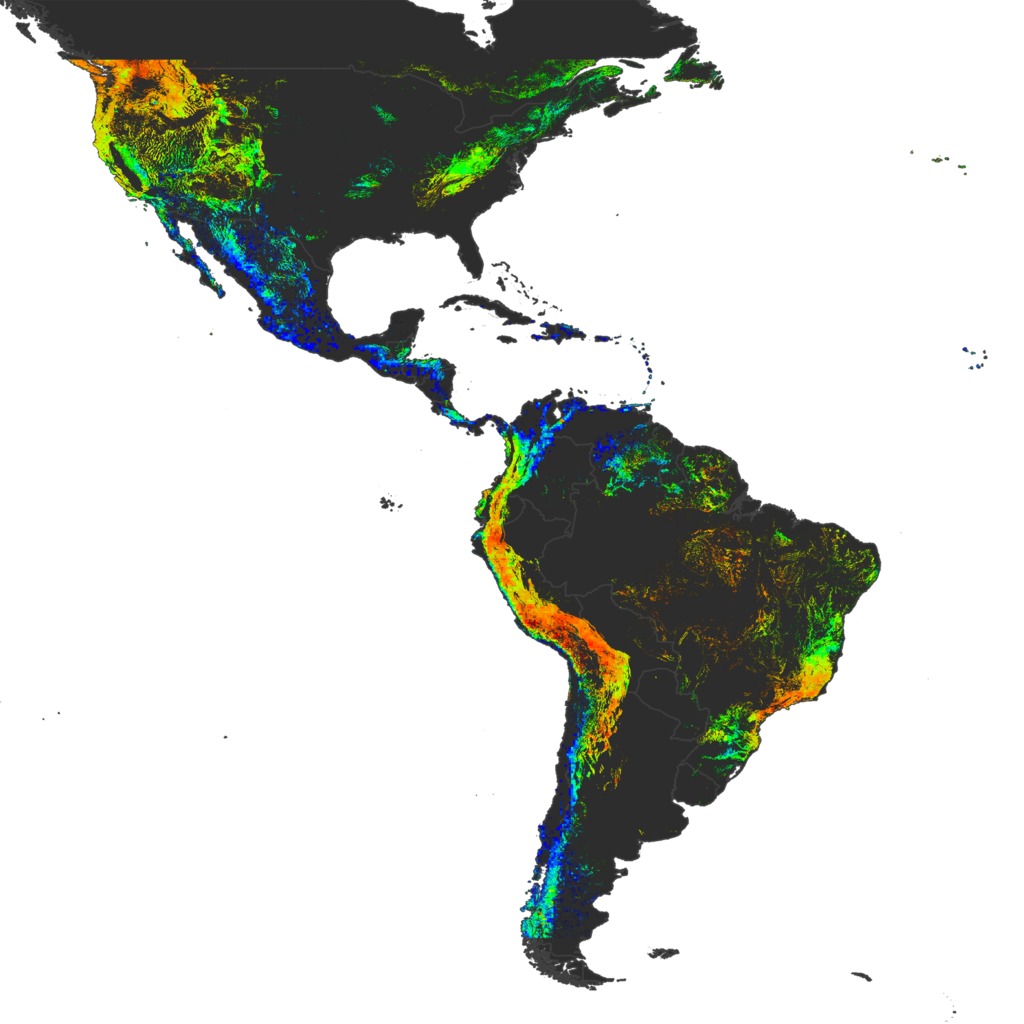
Landslides on N. America’s West Coast in July 2018 are associated with low fatalities and consistent with a history of non-fatal landslides.
For More Information
See NASA.gov
Credits
Please give credit for this item to:
NASA's Scientific Visualization Studio
Animator
- Helen-Nicole Kostis (USRA) [Lead]
Writers
- Kasha Patel (NASA/GSFC) [Lead]
- Michelle Tu (Experiential Learning Program, UMD)
Scientists
- Dalia B Kirschbaum (NASA/GSFC) [Lead]
- Thomas A. Stanley (USRA) [Lead]
Producers
- Joy Ng (KBRwyle) [Lead]
- Ryan Fitzgibbons (KBRwyle) [Lead]
Related pages
Landslide Activity in the Americas for the Cover of <i>Earth's Future</i>
March 22nd, 2018
Read moreA view of the potential landslide activity during January in the Americas, as evaluated by NASA's Landslide Hazard Assessment model for Situational Awareness (LHASA). This still image is provided in 300dpi (print resolution) and in separate layers (water, data, land, outlines). A view of the potential landslide activity during January in the Americas, as evaluated by NASA's Landslide Hazard Assessment model for Situational Awareness (LHASA). This still image is provided in 300dpi (print resolution) with dark background. A view of the potential landslide activity during January in the Americas as evaluated by NASA's Landslide Hazard Assessment model for Situational Awareness (LHASA). This still image is provided in 300dpi (print resolution) with grey background. Colorbar for the landslide climatology. This print-resolution still image was created for the cover of the March 2018 issue of Earth's Future. In an article in the same issue, NASA scientists Dalia Kirschbaum and Thomas Stanley describe the new model they developed to look at potential landslide activity.Landslides occur when an environmental trigger like an extreme rain event, often a severe storm or hurricane, and gravity's downward pull sets soil and rock in motion. Conditions beneath the surface are often unstable already, so the heavy rains act as the last straw that causes mud, rocks, or debris- or all combined- to move rapidly down mountains and hillsides. Unfortunately, people and property are often swept up in these unexpected mass movements. Landslides can also be caused by earthquakes, surface freezing and thawing, ice melt, the collapse of groundwater reservoirs, volcanic eruptions, and erosion at the base of a slope from the flow of river or ocean water. But torrential rains most commonly activate landslides. A new model has been developed to look at how potential landslide activity is changing around the world. A global Landslide Hazard Assessment model for Situational Awareness (LHASA) has been developed to provide an indication of where and when landslides may be likely around the world every 30min. This model uses surface susceptibility (including slope, vegetation, road networks, geology, and forest cover loss) and satellite rainfall data from the Global Precipitation Measurement (GPM) mission to provide moderate to high “nowcasts.” This data driven still image shows the landslide nowcast in the Americas for the month of January leveraging nearly two decades of Tropical Rainfall Measurement Mission (TRMM) rainfall over 2001-2016 to identify a landslide climatology by month at a 1 km grid cell.For more information about the newly developed model, please visit: New NASA Model Finds Landslide Threats in Near Real-Time During Heavy Rains For More InformationSee [https://landslides.nasa.gov](https://landslides.nasa.gov) Related pages
Untitled
Aug. 27th, 2015
Read moreScientists map the location of more than 6,500 landslides. This visualization shows the location of rainfall-triggered landslides and reported number of deaths from 2007 to 2015. This map shows the location of the 1,543 rainfall-triggered landslides and 5,363 fatalities reported in 2010. This map shows the location of the 1,213 rainfall-triggered landslides and 2,151 fatalities reported in 2011. This map shows the location of the 575 rainfall-triggered landslides and 1,462 fatalities reported in 2012. This map shows the location of the 1,055 rainfall-triggered landslides and 6,361 fatalities reported in 2013. This map shows the location of the 880 rainfall-triggered landslides and 3,848 fatalities reported in 2014. Related pages
Global Landslide Hazard Assessment Model (LHASA) with Global Landslide Catalog (GLC) data
April 26th, 2018
Read moreLandslides occur when an environmental trigger like an extreme rain event, often a severe storm or hurricane, and gravity's downward pull sets soil and rock in motion. Conditions beneath the surface are often unstable already, so the heavy rains act as the last straw that causes mud, rocks, or debris- or all combined- to move rapidly down mountains and hillsides. Unfortunately, people and property are often swept up in these unexpected mass movements. Landslides can also be caused by earthquakes, surface freezing and thawing, ice melt, the collapse of groundwater reservoirs, volcanic eruptions, and erosion at the base of a slope from the flow of river or ocean water. But torrential rains most commonly activate landslides. A new model has been developed to look at how potential landslide activity is changing around the world. A global Landslide Hazard Assessment model for Situational Awareness (LHASA) has been developed to provide an indication of where and when landslides may be likely around the world every 30min. This model uses surface susceptibility (including slope, vegetation, road networks, geology, and forest cover loss) and satellite rainfall data from the Global Precipitation Measurement (GPM) mission to provide moderate to high “nowcasts.” This visualization shows the landslide nowcast results leveraging nearly two decades of Tropical Rainfall Measurement Mission (TRMM) rainfall over 2001-2016 to identify a landslide climatology by month at a 1 km grid cell. The average nowcast values by month highlight the key landslide hotspots, such as the Southeast Asia during the monsoon season in June through August and the U.S. Pacific Northwest in December and January. Overlaid with these nowcasts values are a Global Landslide Catalog (GLC) was developed with the goal of identifying rainfall-triggered landslide events around the world, regardless of size, impact, or location. The GLC considers all types of mass movements triggered by rainfall, which have been reported in the media, disaster databases, scientific reports, or other sources. The visualization shows the distribution of landslides each month based on the estimated number of fatalities the event caused. The GLC has been compiled since 2007 at NASA Goddard Space Flight Center and contains over 11,000 reports and growing. A new project called the Community the Cooperative Open Online Landslide Repository, or COOLR, provides the opportunity for the community to view landslide reports and contribute their own. The goal of the COOLR project is to create the largest global public online landslide catalog available and open to for anyone everyone to share, download, and analyze landslide information. More information on this system is available at: https://landslides.nasa.govThe Global Landslide Catalog is currently available here: https://catalog.data.gov/dataset/global-landslide-catalog-export This set of 12 still images show the potential landslide by month averaged over the last 15 years as evaluated by NASA's Landslide Hazard Assessment model for Situational Awareness. The still images are provided in two resolutions: 1920x1080 and 9600x5400. This set of 12 still images showcases the landslide climatology by month overlaid with the distribution of landslides each month based on the estimated number of fatalities the event caused. The estimated number of fatalities is based on values from the Global Landslide Catalog (GLC) for the period 2007-2017. This set of 12 still images provides the months layer in two resoltutions: 1) 1920x1080 and 2) 9600x5400. This set of 12 still images provides the estimated number of fatalities layer by month. The number of fatalities are based on values from the Global Landslide Catalog (GLC). Legend for the reported landslide fatalities. This legend should accompany the fatalities layer (GLC data) of size 1920x1080 Colorbar for the landslide climatology. Using the Global Landslide Catalog, a map, including a legend, has been produced to show the distribution and number of reported fatallities associated with approximately 10,804 rainfall-triggered landslides from 2007-2017. Out of the 10,804 reported rainfall-triggered landslides, 8,369 incidents had zero fatalities. White dots represent incidents with zero reported fatalities. Purple dots (small to large) represent incidents with fatalities in the range of 1-5000. Using the Global Landslide Catalog, a map has been produced to show the distribution and number of reported fatallities associated with approximately 10,804 rainfall-triggered landslides from 2007-2017. Out of the 10,804 reported rainfall-triggered landslides, 8,369 incidents had zero fatalities. White dots represent incidents with zero reported fatalities. Purple dots (small to large) represent incidents with fatalities in the range of 1-5000. Using the Global Landslide Catalog, a map has been produced to show the location of 8,369 zero reported fatalities associated with rainfall-triggered landslides for the period 2007-2017. This is a legend that accompanies the map that shows the distribution and number of fatallities associated with rainfall-triggered landslides in the Global Landslide Catalog for 2007-2017. This legend should accompany the map of size 3840x2160. Hyperwall Source Frames Do you want to display these on the website? Using the Global Landslide Catalog (GLC), a world map has been produced to show the location of 10,804 reported landslides triggered by rainfall for the period 2007-2017. In this version, all landslide locations have the same visual treatment without pointing out which ones had fatalities. This version has been created for kids and educational purposes. This image contains all 10,804 landslide locations with a transparent background. Using the Global Landslide Catalog (GLC), a map has been produced to show the location of 10,804 reported landslides triggered by rainfall for the period 2007-2017. In this version, all landslide locations use the same visual treatment without pointing out which ones had fatalities. This version has been created for kids and educational purposes. World flat map to serve as a background when overlaying the image with transparency provided above. For More InformationSee [https://landslides.nasa.gov](https://landslides.nasa.gov) Related pages
Close-up Views of the Global Landslide Hazard Assessment Model (LHASA) overlaid with Global Landsli…
April 25th, 2018
Read moreA close-up view of the potential landslide activity during July in Southeast Asia as evaluated by NASA's Landslide Hazard Assessment model for Situational Awareness. In the Download tab to the right, a set of 12 still images provides high-resolution (9,600x5,400) global maps to allow for close-up views in any location around the world. The images showcase the landslide climatology by month overload with the distribution of reported landslide fatalities for the period 2007-2017. Colorbar for the landslide climatology. Legend for the reported landslide fatalities. This legend should accompany the visuals of size 9,600x5,400 and should be scaled accordingly to reflect the appropriate size of the dots. This set of 12 still images serves as the months layer. This set of 12 still images show the potential landslide activity by month averaged over the last 15 years as evaluated by NASA's Landslide Hazard Assessment model for Situational Awareness. The still images are global maps and are provided in high-resolution (9,600x5,400) to allow for close-up views in any location around the world. Using the Global Landslide Catalog, a map, including a legend, has been produced to show the distribution and number of reported fatallities associated with approximately 10,804 rainfall-triggered landslides from 2007-2017. Out of the 10,804 reported rainfall-triggered landslides, 8,369 incidents had zero fatalities. White dots represent incidents with zero reported fatalities. Purple dots (small to large) represent incidents with fatalities in the range of 1-5000. This map is provided in 9600x5400 to allow for close-up views in any location around the world or to be previewed on hyperwall. Using the Global Landslide Catalog, a map has been produced to show the location of 8,369 zero reported fatalities associated with rainfall-triggered landslides for the period 2007-2017.This map is provided in 9600x5400 to allow for close-up views in any location around the world or to be previewed on hyperwall. Using the Global Landslide Catalog, a map, has been produced to show the distribution and number of reported fatallities associated with approximately 10,804 rainfall-triggered landslides from 2007-2017. Out of the 10,804 reported rainfall-triggered landslides, 8,369 incidents had zero fatalities. White dots represent incidents with zero reported fatalities. Purple dots (small to large) represent incidents with fatalities in the range of 1-5000. This map is provided in 9600x5400 to allow for close-up views in any location around the world or to be previewed on hyperwall. This is a legend that accompanies the map that shows the distribution and number of fatallities associated with rainfall-triggered landslides in the Global Landslide Catalog for 2007-2017. This legend should accompany the map of size 9600x5400. This entry contains source material for the close-up views of: New NASA Model Finds Landslide Threats in Near Real-Time During Heavy Rains, released on March 22, 2018. High resolution (of size 9,600x5,400) still images have been developed to enable close-up views in any location around the world. The material in this entry is provided by month and in separate layers.Landslides occur when an environmental trigger like an extreme rain event, often a severe storm or hurricane, and gravity's downward pull sets soil and rock in motion. Conditions beneath the surface are often unstable already, so the heavy rains act as the last straw that causes mud, rocks, or debris- or all combined- to move rapidly down mountains and hillsides. Unfortunately, people and property are often swept up in these unexpected mass movements. Landslides can also be caused by earthquakes, surface freezing and thawing, ice melt, the collapse of groundwater reservoirs, volcanic eruptions, and erosion at the base of a slope from the flow of river or ocean water. But torrential rains most commonly activate landslides. A new model has been developed to look at how potential landslide activity is changing around the world. A global Landslide Hazard Assessment model for Situational Awareness (LHASA) has been developed to provide an indication of where and when landslides may be likely around the world every 30min. This model uses surface susceptibility (including slope, vegetation, road networks, geology, and forest cover loss) and satellite rainfall data from the Global Precipitation Measurement (GPM) mission to provide moderate to high “nowcasts.” This visualization shows the landslide nowcast results leveraging nearly two decades of Tropical Rainfall Measurement Mission (TRMM) rainfall over 2001-2016 to identify a landslide climatology by month at a 1 km grid cell. The average nowcast values by month highlight the key landslide hotspots, such as the Southeast Asia during the monsoon season in June through August and the U.S. Pacific Northwest in December and January. Overlaid with these nowcasts values are a Global Landslide Catalog (GLC) was developed with the goal of identifying rainfall-triggered landslide events around the world, regardless of size, impact, or location. The GLC considers all types of mass movements triggered by rainfall, which have been reported in the media, disaster databases, scientific reports, or other sources. The visualization shows the distribution of landslides each month based on the estimated number of fatalities the event caused. The GLC has been compiled since 2007 at NASA Goddard Space Flight Center and contains over 11,000 reports and growing. A new project called the Community the Cooperative Open Online Landslide Repository, or COOLR, provides the opportunity for the community to view landslide reports and contribute their own. The goal of the COOLR project is to create the largest global public online landslide catalog available and open to for anyone everyone to share, download, and analyze landslide information. More information on this system is available at: https://landslides.nasa.govThe Global Landslide Catalog is currently available here: https://catalog.data.gov/dataset/global-landslide-catalog-export For More InformationSee [https://landslides.nasa.gov](https://landslides.nasa.gov) Related pages
New NASA Model Finds Landslide Threats in Near Real-Time During Heavy Rains
March 22nd, 2018
Read moreWatch this video on the NASA Goddard YouTube channel.Complete transcript available.Music credit: 'Inducing Waves' by Ben Niblett [PRS], Jon Cotton [PRS] from Killer Tracks. Data visualizationThis version shows the landslide climatology by month followed by a duplicate run of the landslide climatology overlaid with the distribution of landslides each month based on the estimated number of fatalities the event caused. Data visualizationThis version shows only the landslide climatology (no overlaid fatalities) in order to show seasonality. This version loops two times. Data visualizationThis zoomed in version shows the landslide climatology by month of North, Central and South America followed by a duplicate run of the landslide climatology overlaid with the distribution of landslides each month based on the estimated number of fatalities the event caused. Data visualizationThis zoomed in version shows the landslide climatology by month of Southeast Asia followed by a duplicate run of the landslide climatology overlaid with the distribution of landslides each month based on the estimated number of fatalities the event caused. A GIF optimized for TwitterThis animation shows the potential landslide activity by month averaged over the last 15 years as evaluated by NASA's Landslide Hazard Assessment model for Situational Awareness model. High-resolution imageA close-up view of the potential landslide activity during July in the Americas as evaluated by NASA's Landslide Hazard Assessment model for Situational Awareness model. Overlaid on top are reported landslide fatalities dating back to 2007. High-resolution imageA close-up view of the potential landslide activity during July in Southeast Asia as evaluated by NASA's Landslide Hazard Assessment model for Situational Awareness model. Overlaid on top are reported landslide fatalities dating back to 2007. A new model has been developed to look at how potential landslide activity is changing around the world. A global Landslide Hazard Assessment model for Situational Awareness (LHASA) has been developed to provide an indication of where and when landslides may be likely around the world every 30 minutes. This model uses surface susceptibility (including slope, vegetation, road networks, geology, and forest cover loss) and satellite rainfall data from the Global Precipitation Measurement (GPM) mission to provide moderate to high “nowcasts.” This visualization shows the landslide nowcast results leveraging nearly two decades of Tropical Rainfall Measurement Mission (TRMM) rainfall over 2001-2016 to identify a landslide climatology by month at a 1 km grid cell. The average nowcast values by month highlight the key landslide hotspots, such as the Southeast Asia during the monsoon season in June through August and the U.S. Pacific Northwest in December and January. Overlaid with these nowcasts values are a Global Landslide Catalog(GLC) that was developed with the goal of identifying rainfall-triggered landslide events around the world, regardless of size, impact, or location. The GLC considers all types of mass movements triggered by rainfall, which have been reported in the media, disaster databases, scientific reports, or other sources. The visualization shows the distribution of landslides each month based on the estimated number of fatalities the event caused. The GLC has been compiled since 2007 at NASA's Goddard Space Flight Center and contains over 11,000 reports and growing. A new project called the Community the Cooperative Open Online Landslide Repository, or COOLR, provides the opportunity for the community to view landslide reports and contribute their own. The goal of the COOLR project is to create the largest global public online landslide catalog available and open to for anyone everyone to share, download, and analyze landslide information. More information on this system is available at: https://landslides.nasa.gov. Landslides occur when an environmental trigger like an extreme rain event, often a severe storm or hurricane, and gravity's downward pull sets soil and rock in motion. Conditions beneath the surface are often unstable already, so the heavy rains act as the last straw that causes mud, rocks, or debris- or all combined- to move rapidly down mountains and hillsides. Unfortunately, people and property are often swept up in these unexpected mass movements. Landslides can also be caused by earthquakes, surface freezing and thawing, ice melt, the collapse of groundwater reservoirs, volcanic eruptions, and erosion at the base of a slope from the flow of river or ocean water. But torrential rains most commonly activate landslides.For more information: https://www.nasa.gov/feature/goddard/2018/new-from-nasa-tracking-landslide-hazards-new-nasa-model-finds-landslide-threats-in-near-real For More InformationSee [https://landslides.nasa.gov](https://landslides.nasa.gov) Related pages