ICESat-2 L-30 Science Briefing Graphics
Next month, NASA will launch into space the most advanced laser instrument of its kind, beginning a mission to measure – in unprecedented detail – changes in the heights of Earth’s polar ice.
NASA’s Ice, Cloud and land Elevation Satellite-2 (ICESat-2) will measure the average annual elevation change of land ice covering Greenland and Antarctica to within the width of a pencil, capturing 60,000 measurements every second.
“ICESat-2’s new observational technologies will advance our knowledge of how the ice sheets of Greenland and Antarctica contribute to sea level rise while also helping us understand the connection of sea ice loss to the global system,” said Thomas Wagner, cryosphere program scientist in NASA’s Science Mission Directorate.
ICESat-2 will extend and improve upon NASA's 15-year record of monitoring the change in polar ice heights, which started in 2003 with the first ICESat mission and continued in 2009 with NASA’s Operation IceBridge, an airborne research campaign that monitors the accelerating rate of change.
ICESat-2 represents a major technological leap in our ability to measure changes in ice height. Its Advanced Topographic Laser Altimeter System (ATLAS) measures height by timing how long it takes individual light photons to travel from the spacecraft to Earth and back.
NASA will host a media teleconference at 1 p.m. EDT Wednesday, Aug. 22, to discuss the upcoming launch of the Ice, Cloud and land Elevation Satellite (ICESat-2), which will fly NASA's most advanced laser altimeter to measure Earth’s changing ice. The teleconference will stream live on NASA's website.
ICESat-2 is scheduled to launch Sept. 15 from Vandenberg Air Force Base.
The briefing participants are:
• Tom Wagner, cryosphere program scientist in the Science Mission Directorate (SMD) at NASA Headquarters
• Richard Slonaker, ICESat-2 program executive in SMD
• Doug McLennan, ICESat-2 project manager at NASA’s Goddard Space Flight Center
• Donya Douglas-Bradshaw, Advanced Topographic Laser Altimeter System (ATLAS) instrument project manager at Goddard
• Tom Neumann, ICESat-2 deputy project scientist at Goddard
For more information:
Media Advisory
ICESat-2 Video Resources
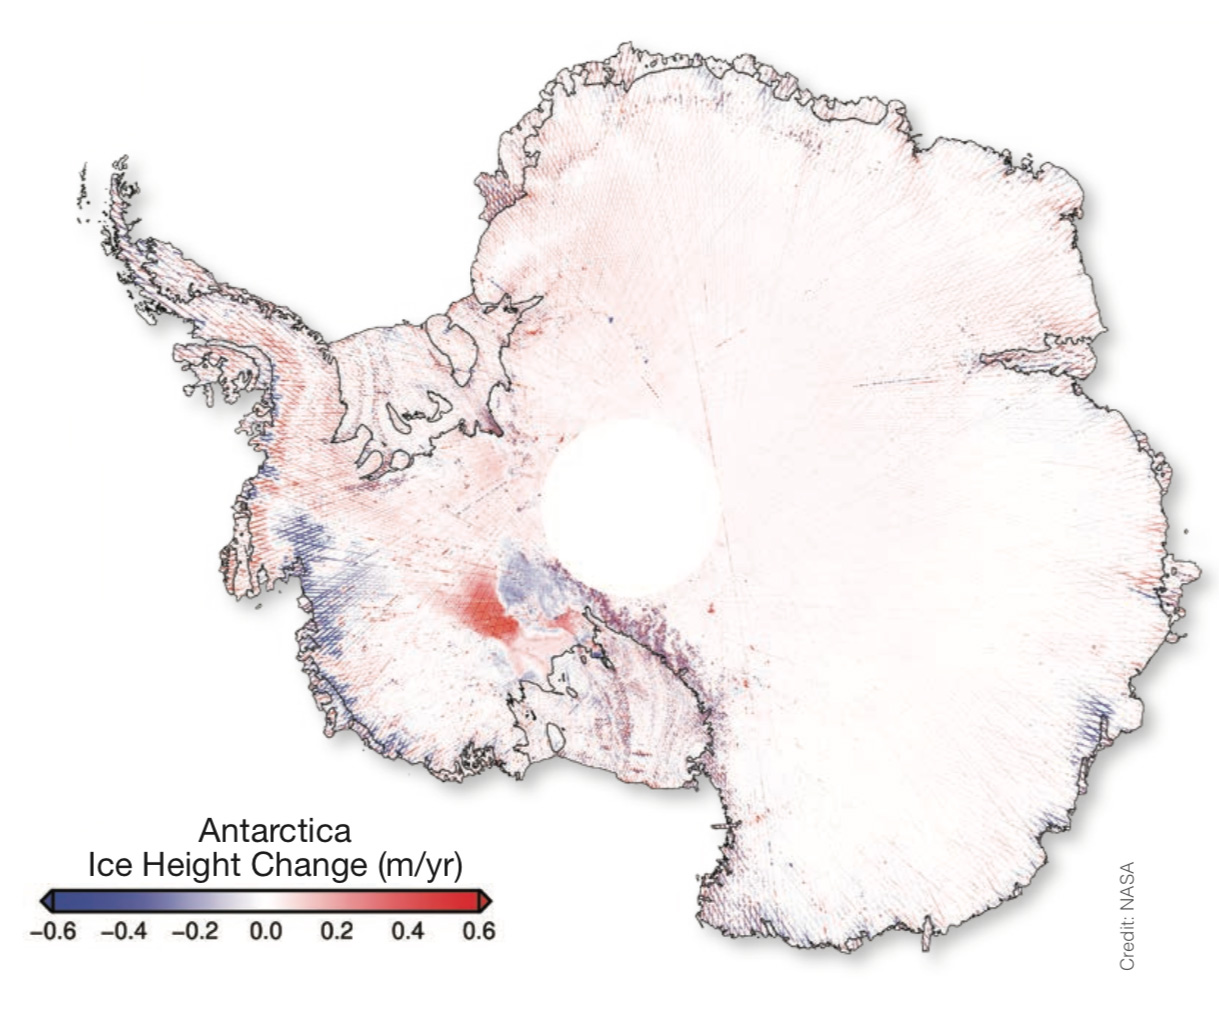
Figure 1 (Wagner) -- Map of change in height of ice in Antarctica, over duration of previous ICESat mission (2003-2009).
Figure 2 (Wagner) -- Aerial footage from Operation IceBridge flights over Earth's polar regions.
Figure 3 (Wagner) -- ICESat-2 will complete all 1,387 of its orbits every 91 days.

Figure 4 (Richard Slonaker) -- NASA's current Earth-observing fleet of satellites, CubeSats, and instruments on the International Space Station.
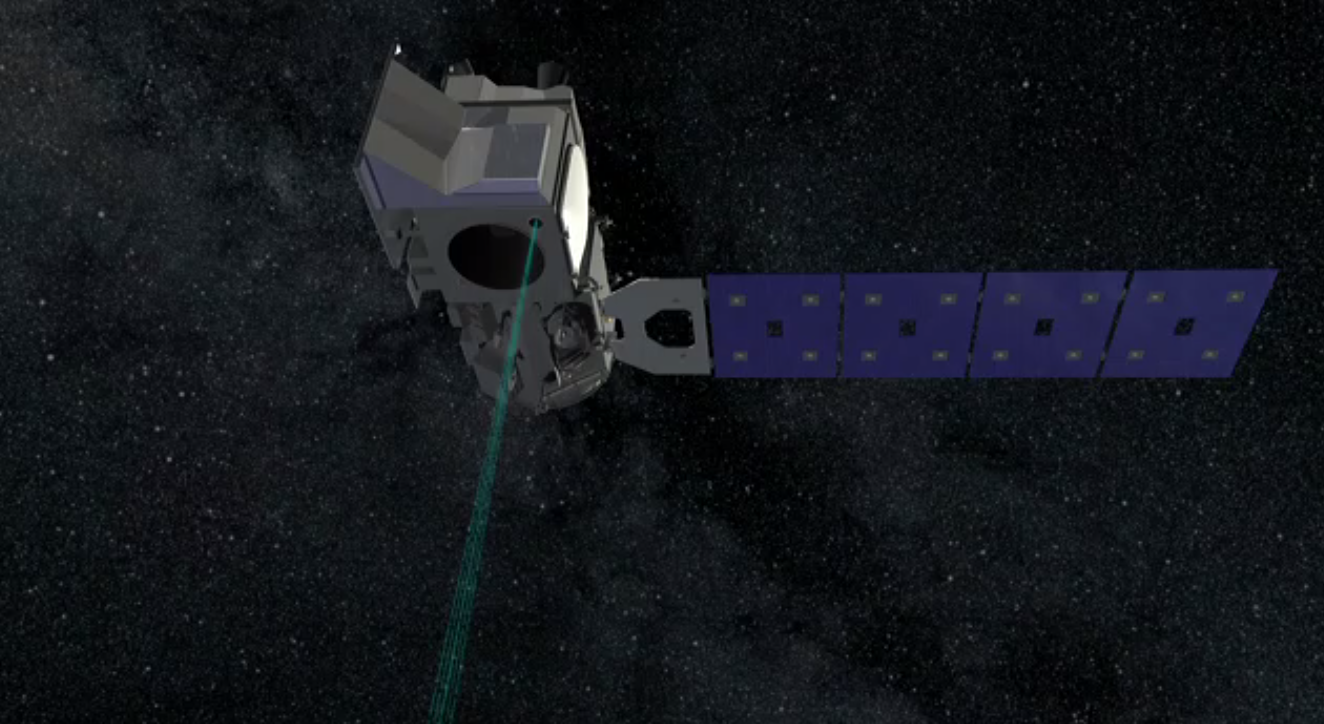
Figure 5 (McLennan) -- Animation showing deployment of the ICESat-2 spacecraft and the laser turning on.
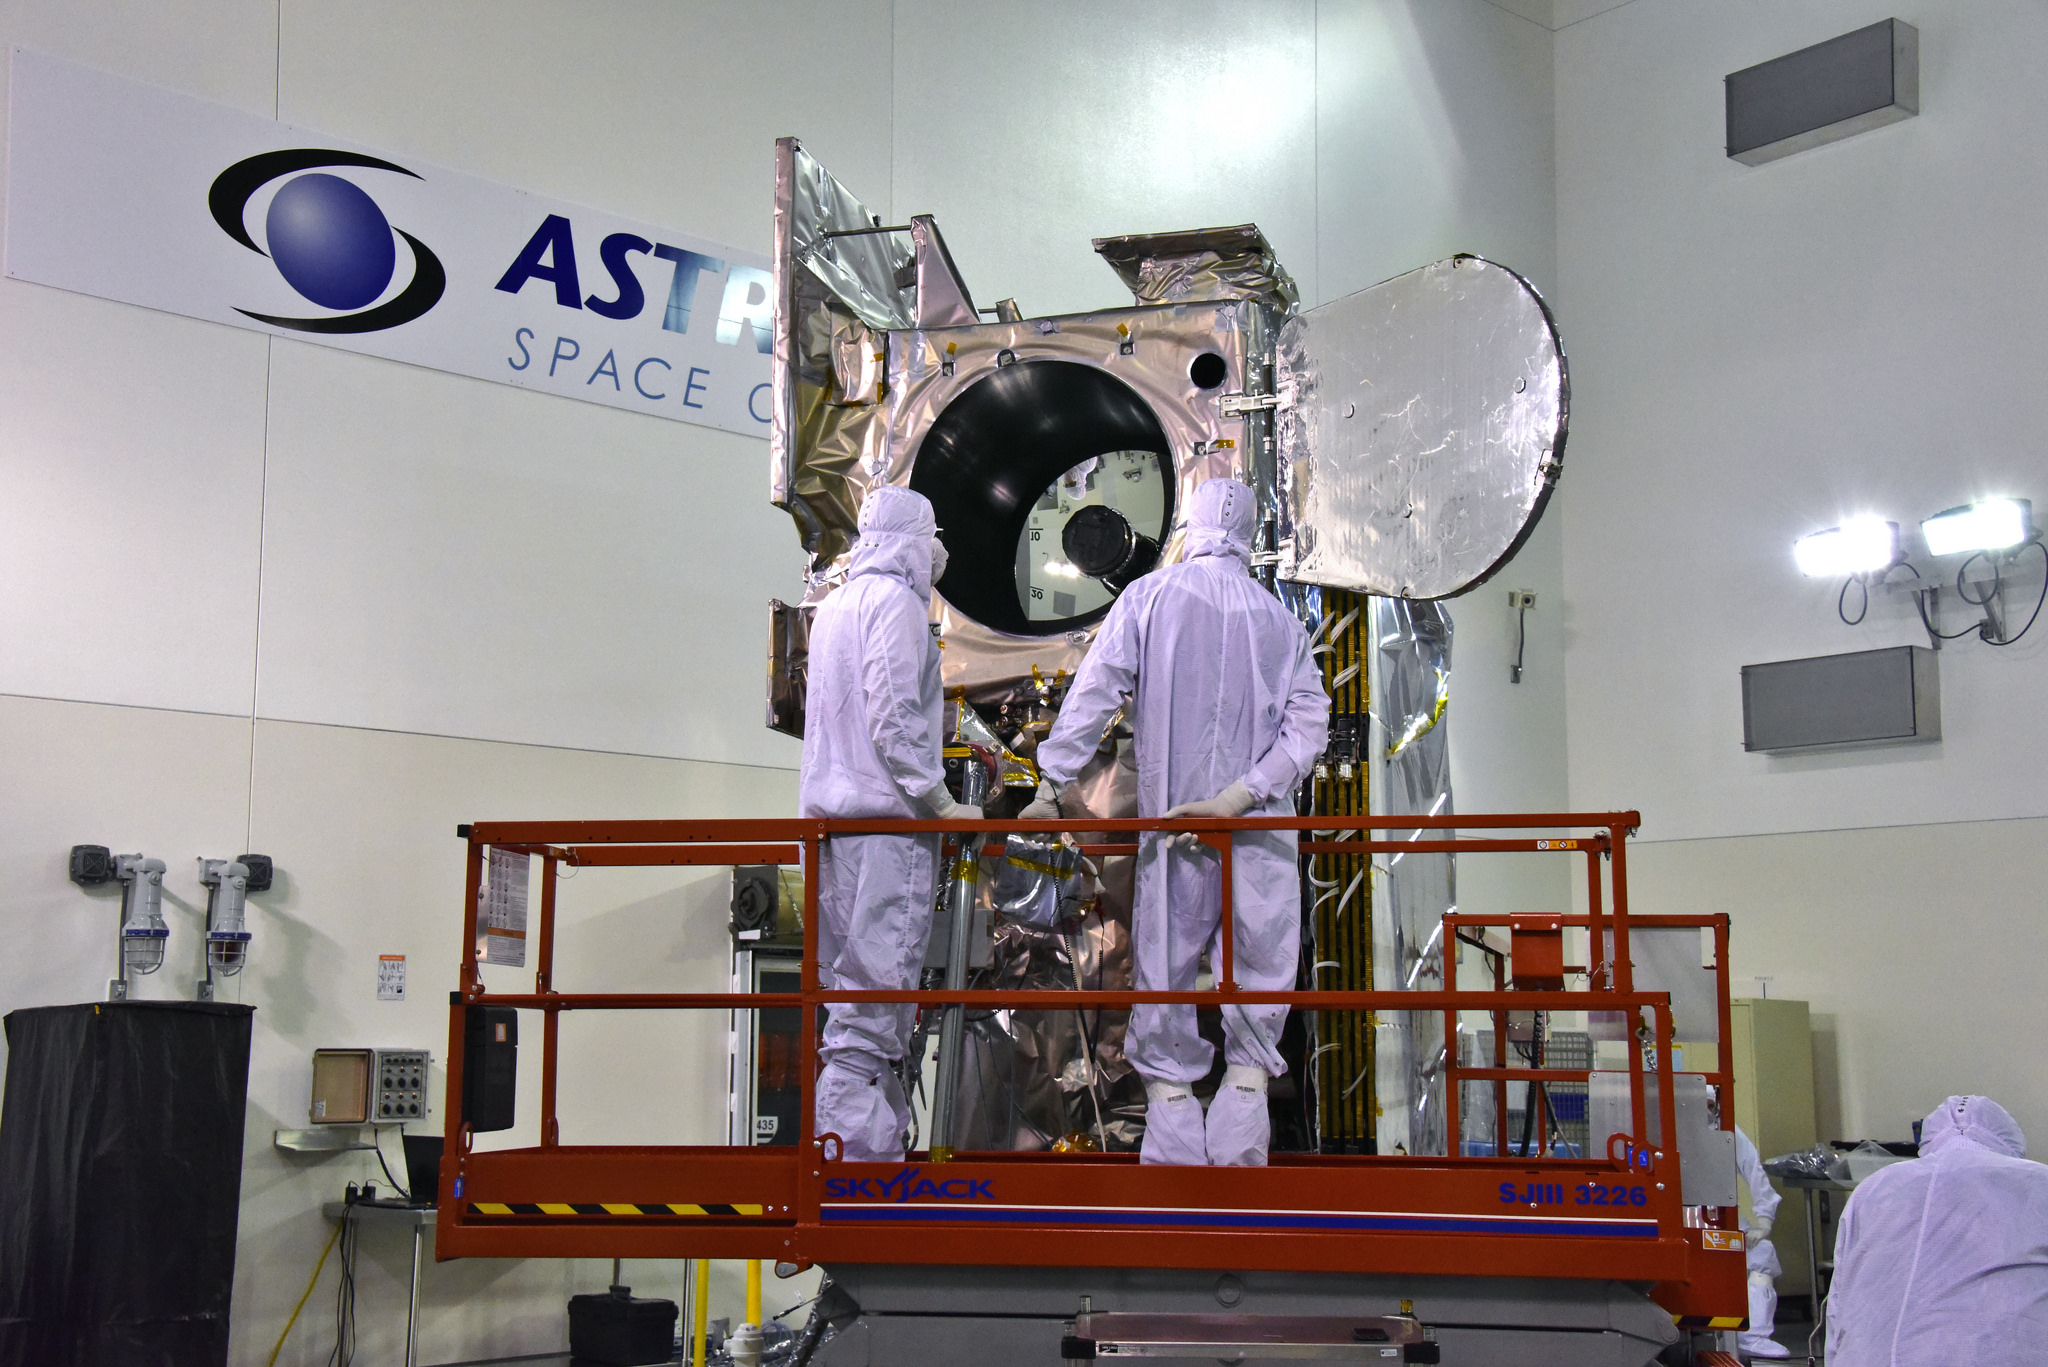
Figure 6 (McLennan) -- The ICESat-2 spacecraft in the clean room at Vandenberg Air Force Base.
Figure 7 (Douglas-Bradshaw) -- Footage of the Advanced Topographic Laser Altimeter System (ATLAS) under construction at NASA's Goddard Space Flight Center.
Figure 8 (Douglas-Bradshaw) -- Footage of the ATLAS instrument entering the Thermal Vacuum Chamber at NASA Goddard.
Figure 9 (Douglas-Bradshaw) -- Animation showing the ATLAS laser firing and how its six beams will cover ground tracks across Earth's surface.
Figure 10 (Neumann) -- Animation showing how ICESat-2 will measure the height of sea ice freeboard (hf) – the portion of sea ice floating above the water – to estimate sea ice thickness (hi).
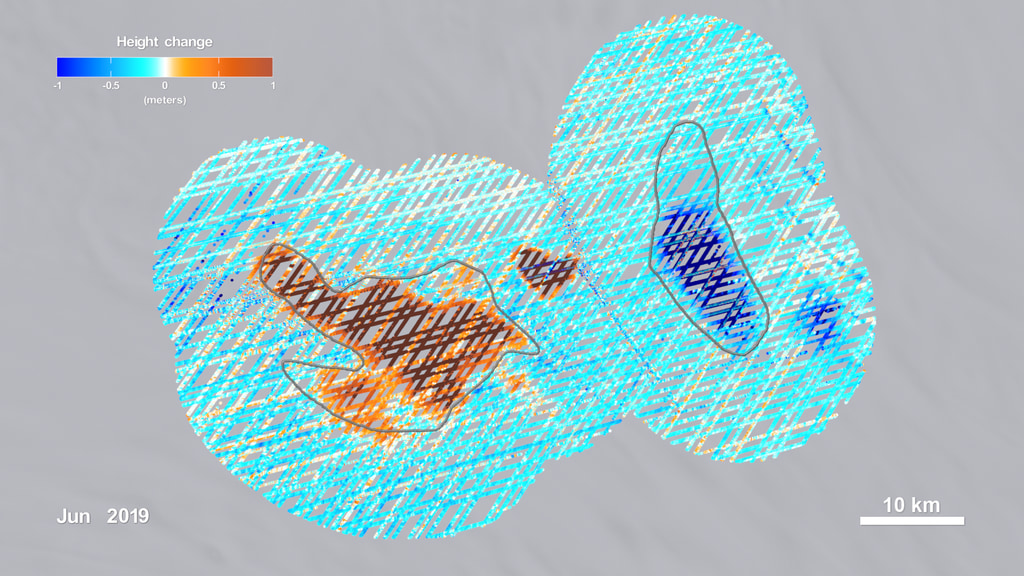
Figure 11 (Neumann) -- This data visualization shows swaths of ice elevation data gathered over the Rink Glacier in Greenland by NASA's Airborne Topographic Mapper, an airborne lidar flown over Greenland regularly since 1993 and on NASA's Operation IceBridge since 2009. The end of the animation compares the scale of the airborne data to the global coverage ICESat-2 will provide.
Figure 12 (Tom Neumann) -- Animation showing how ICESat-2's orbit tracks converge at latitudes of 88 N and 88 S around the North and South poles, providing dense data coverage at those locations.
Figure 13 (Neumann) -- Footage from an Antarctic ice sheet traverse to 88 S, made in the winter of 2017-18 by Tom Neumann and Kelly Brunt of NASA Goddard, to provide highly accurate GPS measurements as a reference for ICESat-2 observations from space.
Credits
Please give credit for this item to:
NASA's Goddard Space Flight Center
-
Producers
- Ryan Fitzgibbons (USRA)
- Patrick Lynch (NASA/GSFC)
-
Scientists
- Thomas A. Neumann (NASA/GSFC)
- Tom Wagner (NASA)
- Donya Douglas Bradshaw (NASA/GSFC)
- Richard Lynn Slonaker (NASA/HQ)
- Douglas D McLennan (NASA/GSFC)
-
Animators
- Adriana Manrique Gutierrez (USRA)
- Walt Feimer (KBR Wyle Services, LLC)
- Chris Meaney (KBR Wyle Services, LLC)
-
Writer
- Kate Ramsayer (Telophase)
-
Visualizers
- Greg Shirah (NASA/GSFC)
- Kel Elkins (USRA)
-
Editor
- Matthew R. Radcliff (USRA)
Release date
This page was originally published on Wednesday, August 22, 2018.
This page was last updated on Wednesday, May 3, 2023 at 1:46 PM EDT.
Missions
This visualization is related to the following missions:Related
- ID: 4913
 Visualization
 - ID: 13045
 Produced Video