2017 Hurricanes and Aerosols Simulation
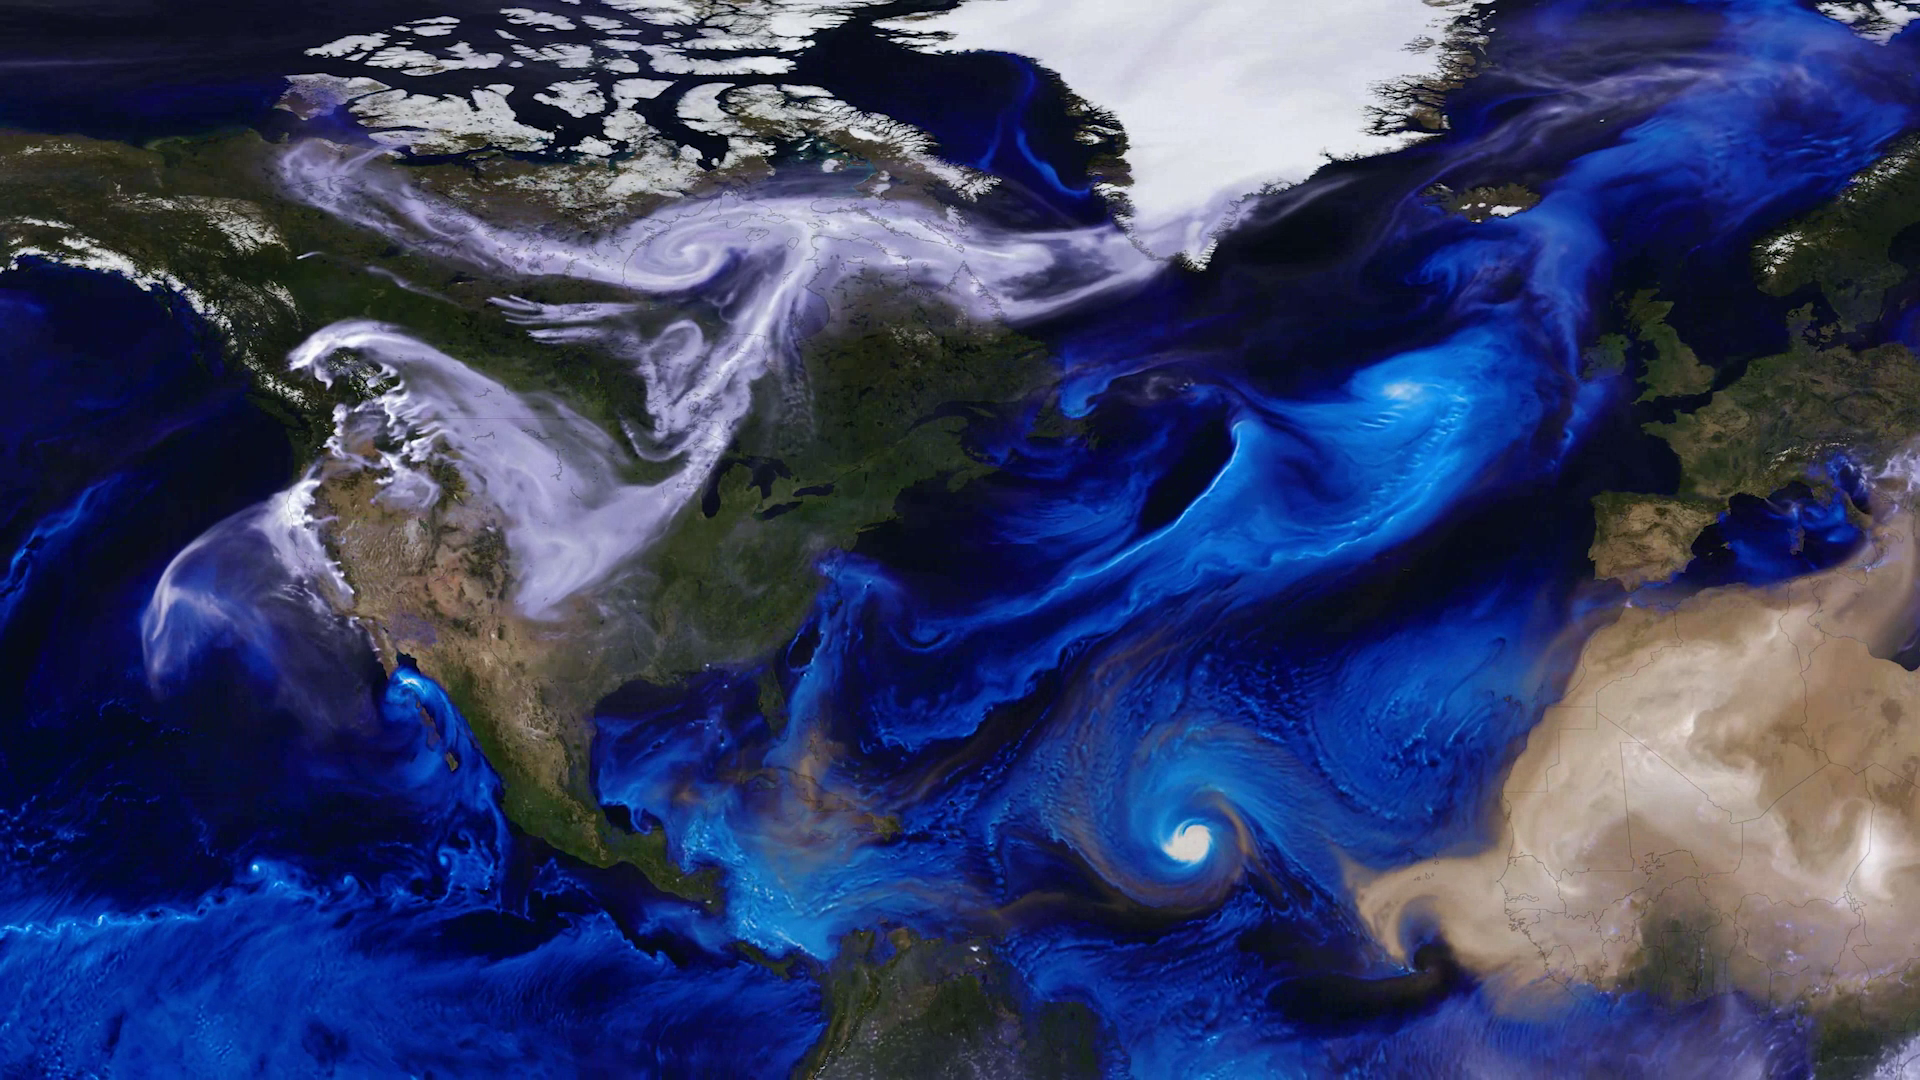
Tracking aerosols over land and water from August 1 to November 1, 2017. Hurricanes and tropical storms are obvious from the large amounts of sea salt particles caught up in their swirling winds. The dust blowing off the Sahara, however, gets caught by water droplets and is rained out of the storm system. Smoke from the massive fires in the Pacific Northwest region of North America are blown across the Atlantic to the UK and Europe. This visualization is a result of combining NASA satellite data with sophisticated mathematical models that describe the underlying physical processes.
Music: Elapsing Time by Christian Telford [ASCAP], Robert Anthony Navarro [ASCAP]
Complete transcript available.
Watch this video on the NASA Goddard YouTube channel.
Tracking the aerosols carried on the winds let scientists see the currents in our atmosphere. This visualization follows sea salt, dust, and smoke from July 31 to November 1, 2017, to reveal how these particles are transported across the map.
The first thing that is noticeable is how far the particles can travel. Smoke from fires in the Pacific Northwest gets caught in a weather pattern and pulled all the way across the US and over to Europe. Hurricanes form off the coast of Africa and travel across the Atlantic to make landfall in the United States. Dust from the Sahara is blown into the Gulf of Mexico. To understand the impacts of aerosols, scientists need to study the process as a global system.
The Global Modeling and Assimilation Office (GMAO) at NASA's Goddard Space Flight Center has developed the Goddard Earth Observing System (GEOS), a family of mathematical models. Combined with data from NASA's Earth observing satellites, the supercomputer simulations enhance our scientific understanding of specific chemical, physical, and biological processes.
During the 2017 hurricane season, the storms are visible because of the sea salt that is captured by the storms. Strong winds at the surface lift the sea salt into the atmosphere and the particles are incorporated into the storm. Hurricane Irma is the first big storm that spawns off the coast of Africa. As the storm spins up, the Saharan dust is absorbed in cloud droplets and washed out of the storm as rain. This process happens with most of the storms, except for Hurricane Ophelia. Forming more northward than most storms, Ophelia traveled to the east picking up dust from the Sahara and smoke from large fires in Portugal. Retaining its tropical storm state farther northward than any system in the Atlantic, Ophelia carried the smoke and dust into Ireland and the UK.
Computer simulations using the GEOS models allow scientists to see how different processes fit together and evolve as a system. By using mathematical models to represent nature we can separate the system into component parts and better understand the underlying physics of each.
GEOS runs on the Discover supercomputer at the NASA Center for Climate Simulation (NCCS)
For more information: NASA@SC17: Glimpse at the Future of Global Weather Prediction and Analysis at NASA
[Versión en español]
Rastreando de aerosoles sobre tierra y agua desde el 1 de agosto hasta el 1 de noviembre de 2017. Los huracanes y las tormentas tropicales son obvios por las grandes cantidades de partículas de sal marina atrapadas en sus vientos arremolinados. Sin embargo, el polvo del Sahara queda atrapado por las gotas de agua y sale por lluvia del sistema de tormentas. El humo de los incendios masivos en la región noroeste del Pacífico de América del Norte cruza el Atlántico hacia el Reino Unido y Europa. Esta visualización es el resultado de combinar datos satelitales de la NASA con sofisticados modelos matemáticos que describen los procesos físicos subyacentes.
Música: Elapsing Time por Christian Telford [ASCAP], Robert Anthony Navarro [ASCAP]
Transcripción completa disponible
Version without hurricane labels, dates, nor legend for color scales.

Colorbars indicating the amount of smoke, sea salt, and dust (expressed as aerosol optical depth at 550 nm), on transparent background.
Video of dates on transparent background.
Credits
Please give credit for this item to:
NASA's Goddard Space Flight Center
-
Producer
- Matthew R. Radcliff (USRA)
-
Technical support
- Aaron E. Lepsch (ADNET Systems, Inc.)
-
Scientists
- William Putman (NASA/GSFC)
- Anton S. Darmenov (NASA/GSFC)
-
Narrators
- Ellen T. Gray (ADNET Systems, Inc.)
- Cristina Porras (GBH)
-
Translator
- Cristina Porras (GBH)
Release date
This page was originally published on Wednesday, May 5, 2021.
This page was last updated on Wednesday, November 15, 2023 at 12:23 AM EST.
Series
This visualization can be found in the following series:Used as a Source In
- ID: 31171
 Hyperwall Visual
 - ID: 13909
 Produced Video
 - ID: 13262
![Music: Broad Horizons by Chris White [PRS]Complete transcript available.](/vis/a010000/a013200/a013262/Still.png) Produced Video
Produced Video - ID: 13216
![Complete transcript available.Music credits: “Northern Breeze” by Denis Levaillant [SACEM], “Stunning Horizon” by Maxime Lebidois [SACEM], Ronan Maillard [SACEM], “Magnetic Force” by JC Lemay [SACEM] from Killer TracksWatch this video on the NASA Goddard YouTube channel.This video can be freely shared and downloaded. While the video in its entirety can be shared without permission, some individual imagery provided by pond5.com is obtained through permission and may not be excised or remixed in other products. Specific details on stock footage may be found here. For more information on NASA’s media guidelines, visit https://www.nasa.gov/multimedia/guidelines/index.html.Notes on footage:• 0:03 - 0:17 provided by Pond5• 1:38 - 1.43 provided by Pond5• 1:49 - 1:52 provided by Pond5• 2:21 - 1:27 provided by Pond5](/vis/a010000/a013200/a013216/13216_NASA_Has_Eyes_On_The_Atlantic_Hurricane_Season_YouTube.00050_print.jpg) Produced Video
Produced Video - ID: 12983
 Produced Video