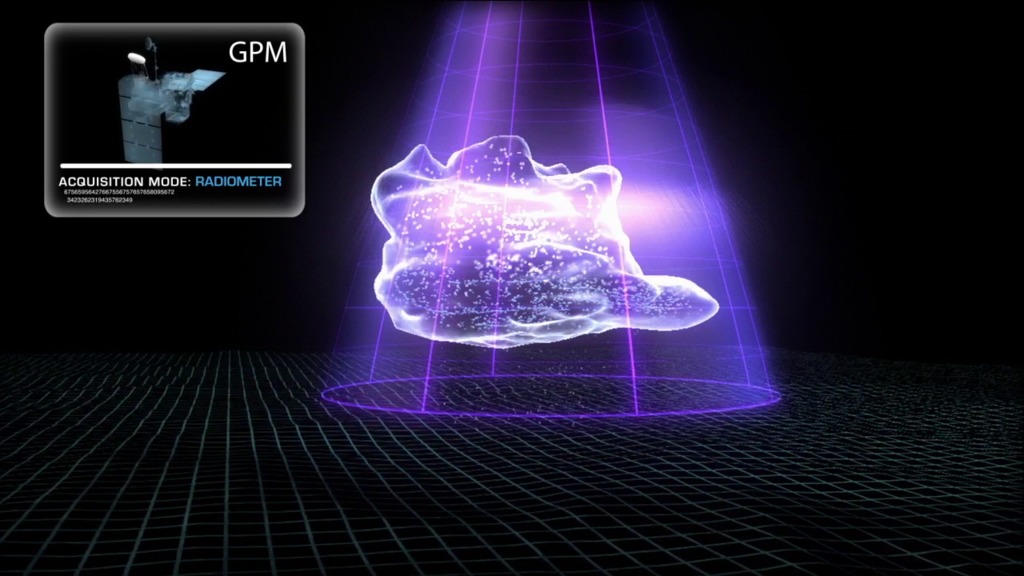
GPM Has Best Calibrated Microwave Imager in the World
- Visualizations by:
- Lisa Poje
- Written by:
- Kasha Patel
- Scientific consulting by:
- Gail Skofronick Jackson and
- Chris Kidd
- Produced by:
- Ryan Fitzgibbons
- View full credits

This is an infographic describing how the GPM Microwave Imager works and maintains its high degree of calibration, as well as how it contributes to the precipitation rates produced by the mission.
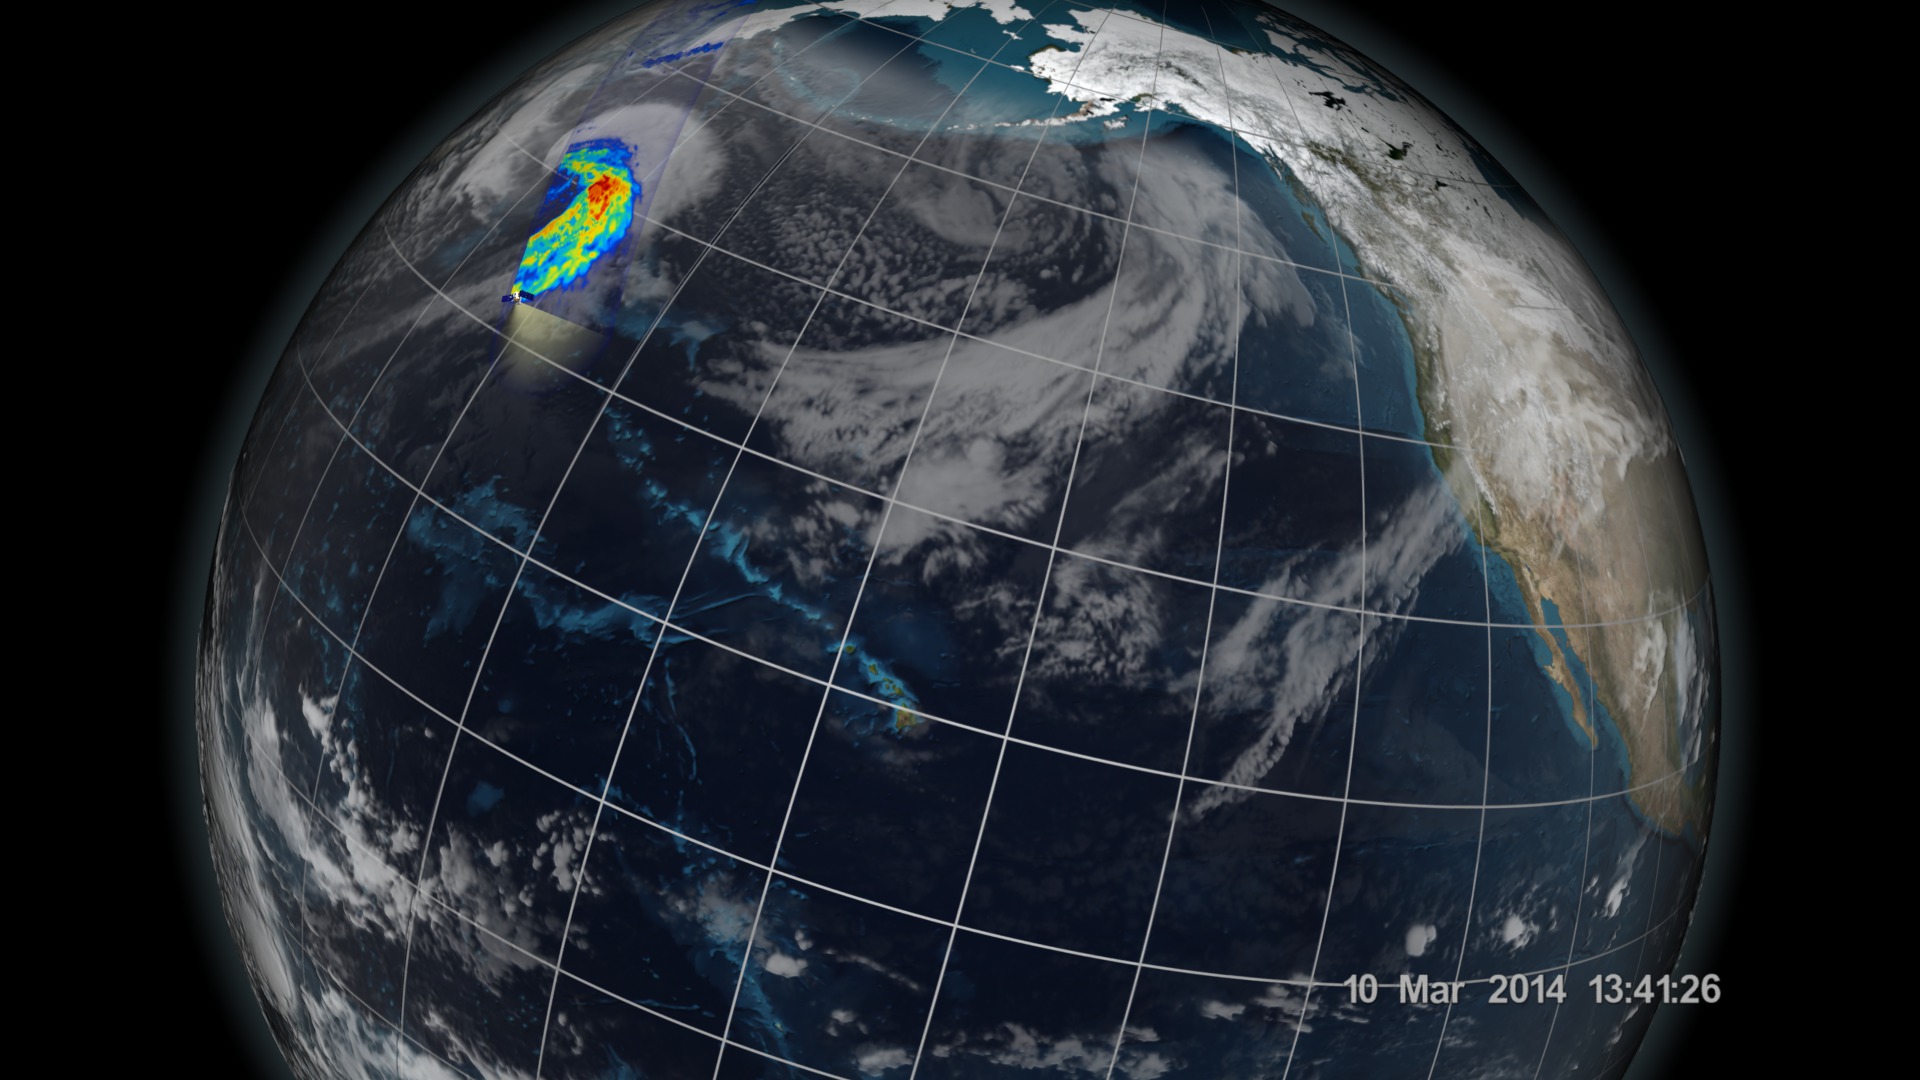
Credits
Please give credit for this item to:
NASA's Goddard Space Flight Center
Animator
- Lisa Poje (USRA) [Lead]
Writer
- Kasha Patel (NASA/GSFC) [Lead]
Scientists
- Gail Skofronick Jackson (NASA/GSFC) [Lead]
- Dalia B Kirschbaum (NASA/GSFC)
Scientific data support
- Chris Kidd (University of Maryland) [Lead]
Producer
- Ryan Fitzgibbons (KBRwyle) [Lead]
Missions
This visualization is related to the following missions:Related pages
Snow Live Shots (Feb. 17, 2017)
Feb. 7th, 2017
Read moreB-roll for NASA interviews on Friday, February 17, 2017. Soundbites from NASA Scientist Dr. Dalia Kirschbaum. Includes TEXT transcript file. Note that slates separate the questiosn and for 4 questions there are two options - one without graphics and one with graphics. Researchers have completed the first flights of a NASA-led field campaign that is targeting one of the biggest gaps in scientists' understanding of Earth's water resources: snow.Complete transcript available. Canned interview with graphics with NASA Scientist Dr. Dalia Kirschbaum Short NASA snow facts social media video. Canned Interview with NASA Scientist Dorothy Hall NASA Views Snow from Space: What a Difference a Year MakesSnow doesn’t fall everywhere, but how much falls and where has global consequencesThe snapshot of snow from space tells a different story every year. Last January, a winter storm pummeled the east coast and broke several snowfall records. This winter the Sierra Nevada was hit by consecutive storms, each one piling more snow on top of the last storm's snow. NASA’s view from space highlights these dramatic differences, but the story is incomplete.More than a sixth of the world’s population relies on melt water from seasonal snowpack and glaciers, but it is challenging to measure the volume and depth of snow cover, especially in remote locations and dense forests. Determining exactly how much snow is on the ground globally and understanding the contribution of winter storms to the world’s water resources are key pieces to the Earth system puzzle.NASA is in the field right now, testing techniques and technologies for measuring snow’s water content. Join NASA scientists on Friday, February 17, from 6:00 a.m – 11:30 a.m. EST to show your viewers NASA’s snow imagery and discuss strides towards improved space-based measurement of snow on Earth.The effects of snow are global. For example, California’s Central Valley, which relies on seasonal snow melt, constitutes only 2 percent of US cropland, yet it produces nearly half the nation’s fruits and nuts. The benefits of snow measurements are huge because of the importance of snow to agriculture, water security, natural hazards and more.Thanks to a half-century of snow observations, we know these amazing facts, which are crucial to understanding what’s necessary to advance snow measurements.• More than one-sixth of the world’s population (1.2 billion people) relies on melt water from snowpack and glaciers. • Up to 70 percent of water resources in the western United States are from snow melt. In California, more than 70 percent of water from the San Joaquin River, which originates from Sierra Nevada snow, is used to irrigate the Central Valley.• 60 million people in the U.S. rely on snowmelt as their primary source of freshwater.• Globally, 30 percent of land area gets covered by snow and about half of the snow cover area has tree cover of some sort.• Since 1967, a million square miles of spring snow cover has disappeared from the Northern Hemisphere, an area the size of the entire southwestern United States.• NASA’s Global Precipitation Measurement Mission (GPM) tracks falling snow, including off the coast where few observations exist, in the mountains where ground-based radar may have challenges, and even at the tops of hurricanes.• Snowflakes (crystals) have six sides, but most of the snowflakes we see are multiple crystals stuck together. Snow crystals stick together and begin to change or metamorphose as soon as they fall to the ground.• The same sensing technology used to measure seasonal snowpack on Earth can be used to measure ice on Mars.*** To Book a Window ***Contact Clare Skelly – clare.a.skelly@nasa.gov / 301-286-4994 (office)HD Satellite Coordinates for G17-K18Upper: Galaxy 17 Ku-band Xp 18 Slot Upper| 91.0 ° W Longitude | DL 12069.0 MHz | Vertical Polarity | QPSK/DVB-S | FEC 3/4 | SR 13.235 Mbps | DR 18.2954 MHz | HD 720p | Format MPEG2 | Chroma Level 4:2:0 | Audio EmbeddedSuggested Questions:1. NASA satellites see snow cover from space. How does this winter compare to previous years?2. NASA scientists are in the field right now testing advanced technologies for measuring snow. How will these new measurements be used? 3. Can NASA actually see falling snow from space?4. Up to 70 percent of water resources in the western United States come from snow melt. California has been getting heavy rain and snow recently, does that mean the drought is over?5. How does snow impact parts of the country that rarely see any snowfall?6. Where can we learn more?Scientists:Dorothy Hall / NASA Scientist—or—Matthew Rodell / NASA Scientist—or—Dalia Kirschbaum / NASA Scientist Related pages
GPM/GMI First Light
March 24th, 2014
Read moreThis animation shows GPM collecting some of it's very first data on March 10th over a Pacific storm east of Japan. The animation begins with GPM collecting 37 GHz horizontally polarized brightness temperature data over the storm (in shades of aquamarine). All of GPM's 13 bands are then spread out to reveal the entire range of brightness temperature data. This data then collapses into rain rates for this storm, which are colored in a rainbow spectrum going from blue (low values) to dark red (high values). As the camera pulls out, GPM continues traversing the globe showing rain rates for the remainder of the swath. This animation rides along with the satellite revealing 37 GHz horizontally polarized Brightness Temperature data over the ground (in shades of aquamarine) as the satellite goes through one orbit. This animation rides along with the satellite revealing rain rates (in a rainbow colormap, where blue is low, and dark red is high) as the satellite goes through one orbit. Print resolution still of GPM/GMI collecting 37 GHz horizontally polarized Brightness Temperature data (colored in shades of aquamarine) on March 10th over a Pacific storm east of Japan. Print resolution still of all 13 GPM/GMI bands grouped according to the kinds of precipitation that they help detect. This image shows the brightness temperature data from GMI’s 13 passive microwave channels. From left to right the channels are 10.6 GHz vertical polarization (V), 10.6 horizontal polarization (H), 18.7 V, 18.7 H, 23 V, 37 V, 37 H, 89 V, 89 H, 166 V, 166 H, 183+/-3 V, 183+/-7 V GHz and are labeled thusly. Frequencies between 10-23 GHz are sensitive primarily to liquid rain, between 36-89 GHz the channels are sensitive to both liquid and frozen precipitation, while the high frequencies are sensitive to frozen (snow) precipitation. Print resolution still of all 13 GPM/GMI bands grouped according to the kinds of precipitation that they help detect. The 5 bands to the left are sensitive primarily to liquid rain. The middle 4 are sensitive to both liquid and frozen precipitation, and the rightmost 4 are sensitive to frozen (snow) precipitation, as the associated icons represent. Print resolution still of all 13 GPM/GMI bands without additional annotations. Print resolution still showing rain rates across a 550-mile (885 kilometer) wide swath of an extra-tropical cyclone observed off the coast of Japan on March 10, 2014. Red areas indicate heavy rainfall, while yellow and blue indicate less intense rainfall. The upper right blue areas indicate falling snow.This image also includes an icon representing rain rates across a rainbow colored spectrum with blue on the left and dark red on the far right. Print resolution still showing rain rates across a 550-mile (885 kilometer) wide swath of an extra-tropical cyclone observed off the coast of Japan on March 10, 2014. Red areas indicate heavy rainfall, while yellow and blue indicate less intense rainfall. The upper right blue areas indicate falling snow. Print resolution still of the GPM rain rate swath spanning across the entire Pacific Ocean on March 10th. Print resolution still of GPM collecting 37 GHz horizontally polarized Temperature Brightness data (colored in shades of aquamarine) on March 10th over a Pacific storm east of Japan. Print resolution still showing rain rates across a 550-mile (885 kilometer) wide swath of an extra-tropical cyclone observed off the coast of Japan on March 10, 2014. Red areas indicate heavy rainfall, while yellow and blue indicate less intense rainfall. The upper left blue areas indicate falling snow. Print resolution still showing a top down view of GPM/GMI's 37 GHz horizontally polarized Brightness Temperature swath (depicted in shades of aquamarine) as it cuts across from the top of the image down to the lower right. Japan can be seen in the center left portion of the image. Print resolution still showing a top down view of GPM rain rate swath as it cuts across from the top center of the image down to the lower right. Red areas indicate heavy rainfall, while yellow and blue indicate less intense rainfall. The upper blue areas indicate falling snow. Japan can be seen in the center left portion of the image. Print resolution still showing a top down view of GPM rain rate swath as it cuts across from the top center of the image down to the lower right. Red areas indicate heavy rainfall, while yellow and blue indicate less intense rainfall. The upper blue areas indicate falling snow. Japan can be seen in the center left portion of the image. No datestamp is shown in this image. Print resolution icon used to symbolize liquid and frozen precipitation. Print resolution icon used to symbolize frozen precipitation (ie, snow). Print resolution icon used to symbolize rain rates. Print resolution still showing a top down view of GPM rain rate swath as it cuts across from the top center of the image down to the lower right. Red areas indicate heavy rainfall, while yellow and blue indicate less intense rainfall. The upper blue areas indicate falling snow. Japan can be seen in the center left portion of the image. There is no timestamp with this image. Eleven days after the Feb. 27 launch of the Global Precipitation Measurement (GPM) Core Observatory, the two instruments aboard took their first joint images of an interesting precipitation event. On March 10, the Core Observatory passed over an extra-tropical cyclone about 1055 miles (1700 kilometers) due east of Japan's Honshu Island. The storm formed from the collision of a cold front wrapping around a warm front, emerging over the ocean near Okinawa on March 8. It moved northeast over the ocean south of Japan, drawing cold air west-to-east over the land, a typical winter weather pattern that also brought heavy snow over Hokkaido, the northernmost of the four main islands. After the GPM images were taken, the storm continued to move eastward, slowly intensifying before weakening in the central North Pacific.This visualization shows data from the GPM Microwave Imager, which observes different types of precipitation with 13 channels. Scientists analyze that data and then use it to calculate the light to heavy rain rates and falling snow within the storm.For more information on this topic: GPM web siteOther multimedia items related to this story: GPM GMI First Light (#11508) GPM DPR First Light (#11509) All multimedia items from this point on are print stills. Related pages
GPM Instrument Animations
April 15th, 2013
Read moreAnimations showing the GMI then DPR instruments on board the GPM Core Observatory. This conceptual animation shows the GPM Microwave Imager (GMI) and the Dual-frequency Precipitation Radar (DPR) scanning through a cloud detecting various precipitation particles. Related pages