Carbon and Climate Briefing - November 12, 2015

Earth’s land and ocean currently absorb about half of all carbon dioxide emissions from the burning of fossil fuels, but it’s uncertain whether the planet can keep this up in the future. NASA’s Earth science program works to improve our understanding of how carbon absorption and emission processes work in nature and how they could change in a warming world with increasing levels of carbon dioxide and methane emissions from human activities.
NASA will host a media teleconference at noon EST on Thursday, Nov. 12, at noon EST to discuss the latest insights into how Earth is responding to rising levels of heat-trapping gases in the atmosphere, and what this means for our future climate.
Later this month, a United Nations climate meeting in Paris will focus on setting limits on future levels of human-produced carbon emissions. This NASA briefing will present new observations from the Orbiting Carbon Observatory-2 (OCO-2) mission, NASA’s first satellite dedicated to measuring carbon dioxide, and preview field work planned in the North Atlantic and Alaska.
Participating in the briefing:
Michael Freilich, director of NASA’s Earth Science Division at the agency’s headquarters in Washington
Mike Behrenfeld, principal investigator for NASA’s NAAMES field campaign, Oregon State University in Corvallis
George Hurtt, lead for NASA’s Carbon Monitoring System, University of Maryland in College Park
Annmarie Eldering, deputy project scientist for NASA’s OCO-2 mission at the agency’s Jet Propulsion Laboratory in Pasadena, California
* Lesley Ott, research scientist in the Global Modeling and Assimilation Office at NASA’s Goddard Space Flight Center in Greenbelt, Maryland
Listen to a recording of the briefing.
For more information:
Carbon and Climate feature story
Press Release: As Earth Warms, NASA Targets ‘Other Half’ of Carbon, Climate Equation
Carbon and Climate Video Resources
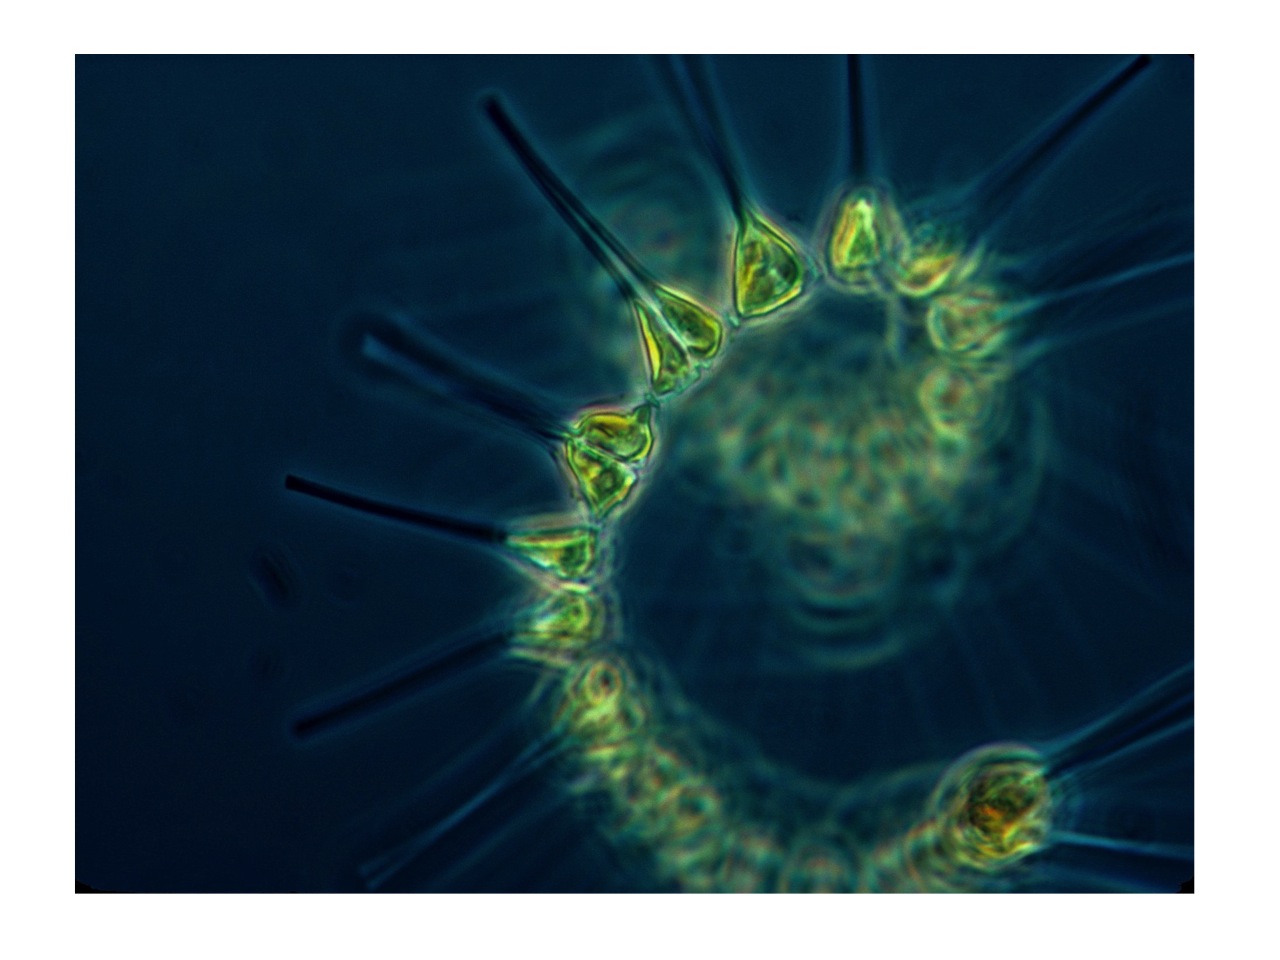
Figure 1 (Behrenfeld) -- Microscopic phytoplankton serve as the basis of the marine food web and, due to their abundance, play an integral role in the planet’s climate.
Credit: NOAA
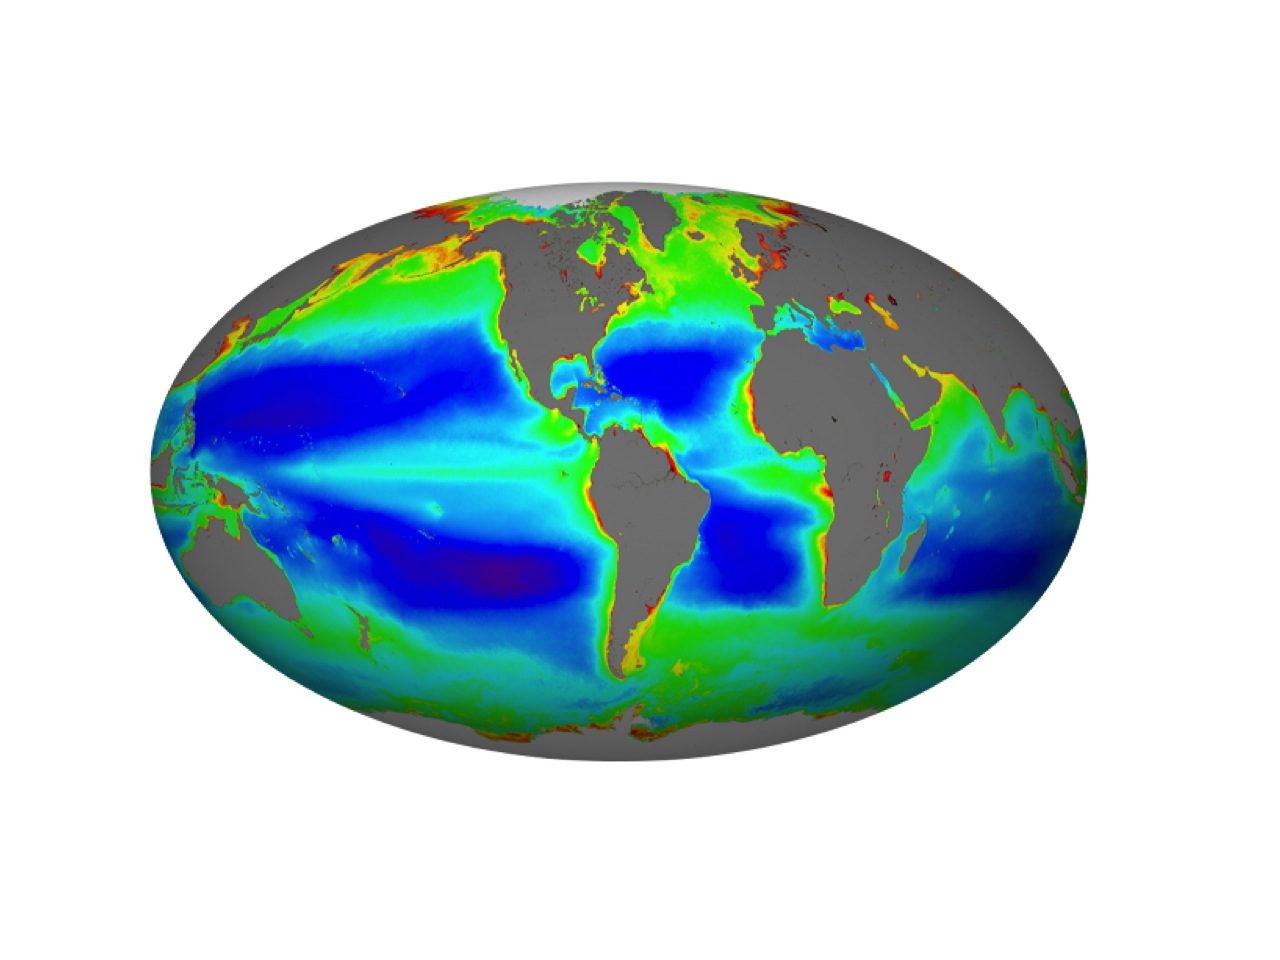
Figure 2 (Behrenfeld) -- In recent years NASA satellites have allowed scientists to map the average distribution of phytoplankton around the world.
Credit: NASA
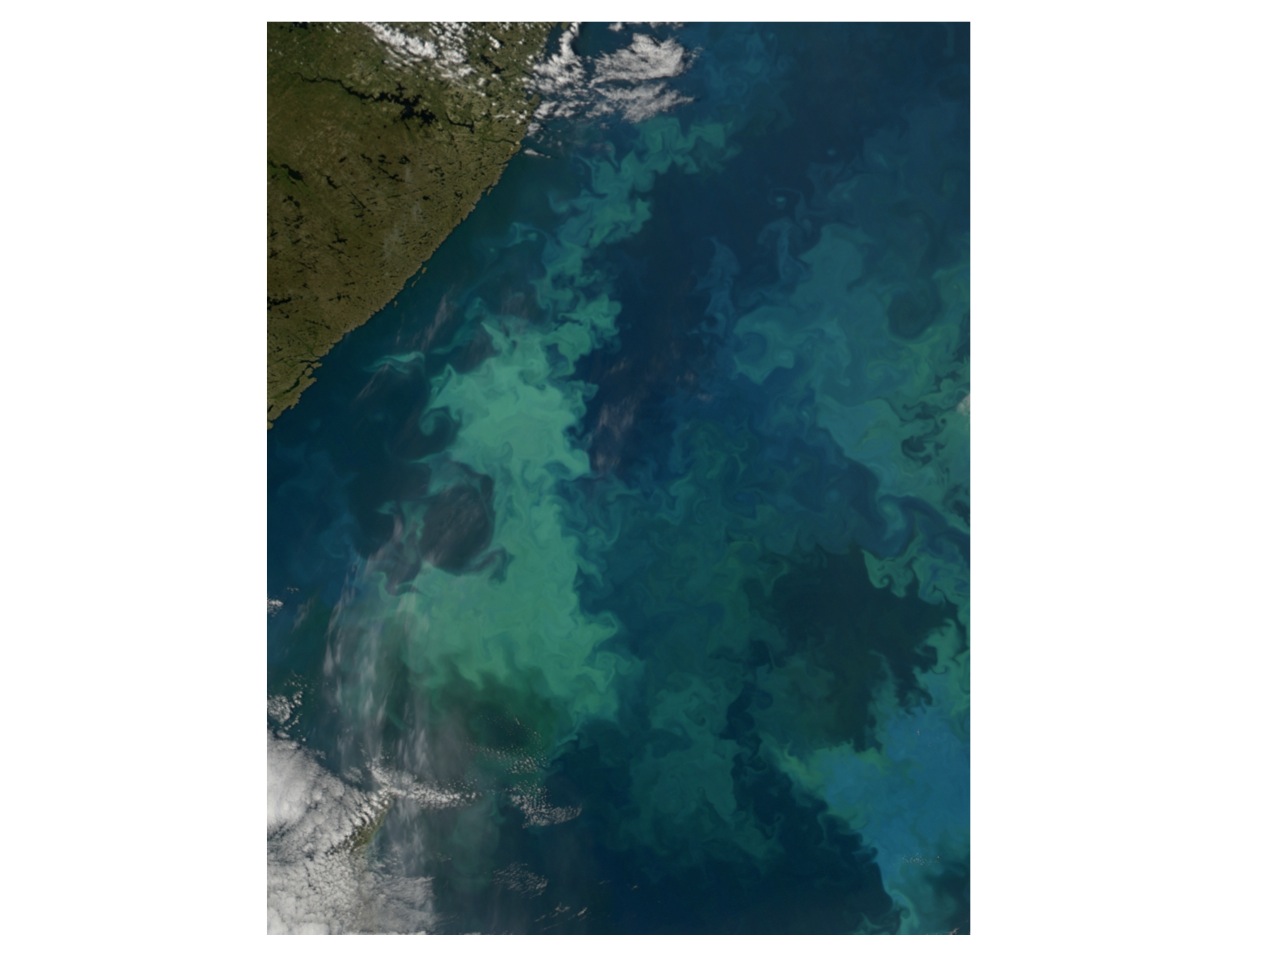
Figure 3 (Behrenfeld) -- Satellites can observe massive blooms that spread and change rapidly.
Credit: NASA
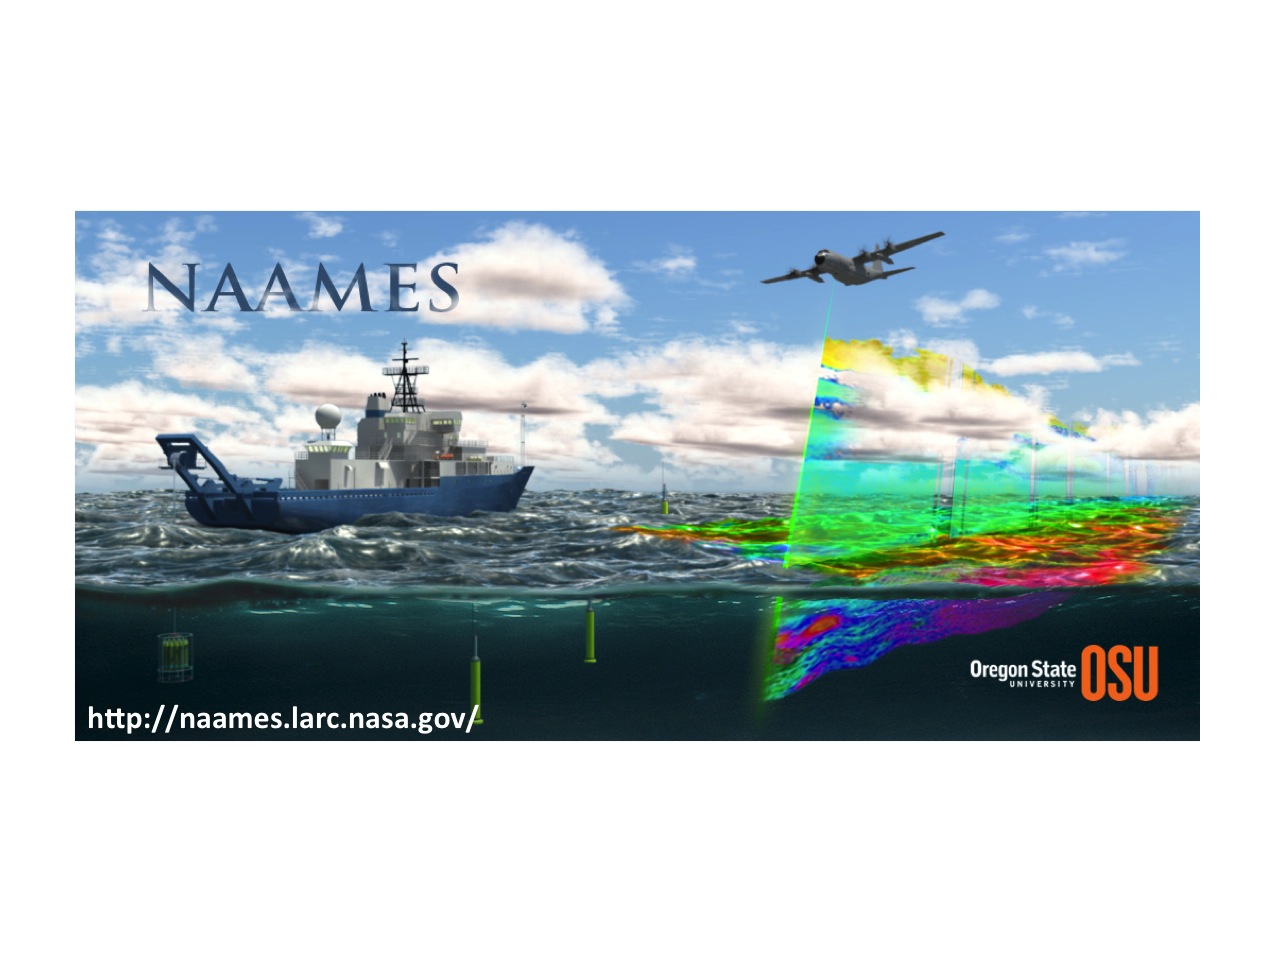
Figure 4 (Behrenfeld) -- NASA’s ongoing NAAMES (North Atlantic Aerosols and Marine Ecosystems Study) is using shipborne and airborne observations to study key links between the ocean processes that determine phytoplankton blooms and their ultimate link to the climate.
Credit: NASA/Oregon State
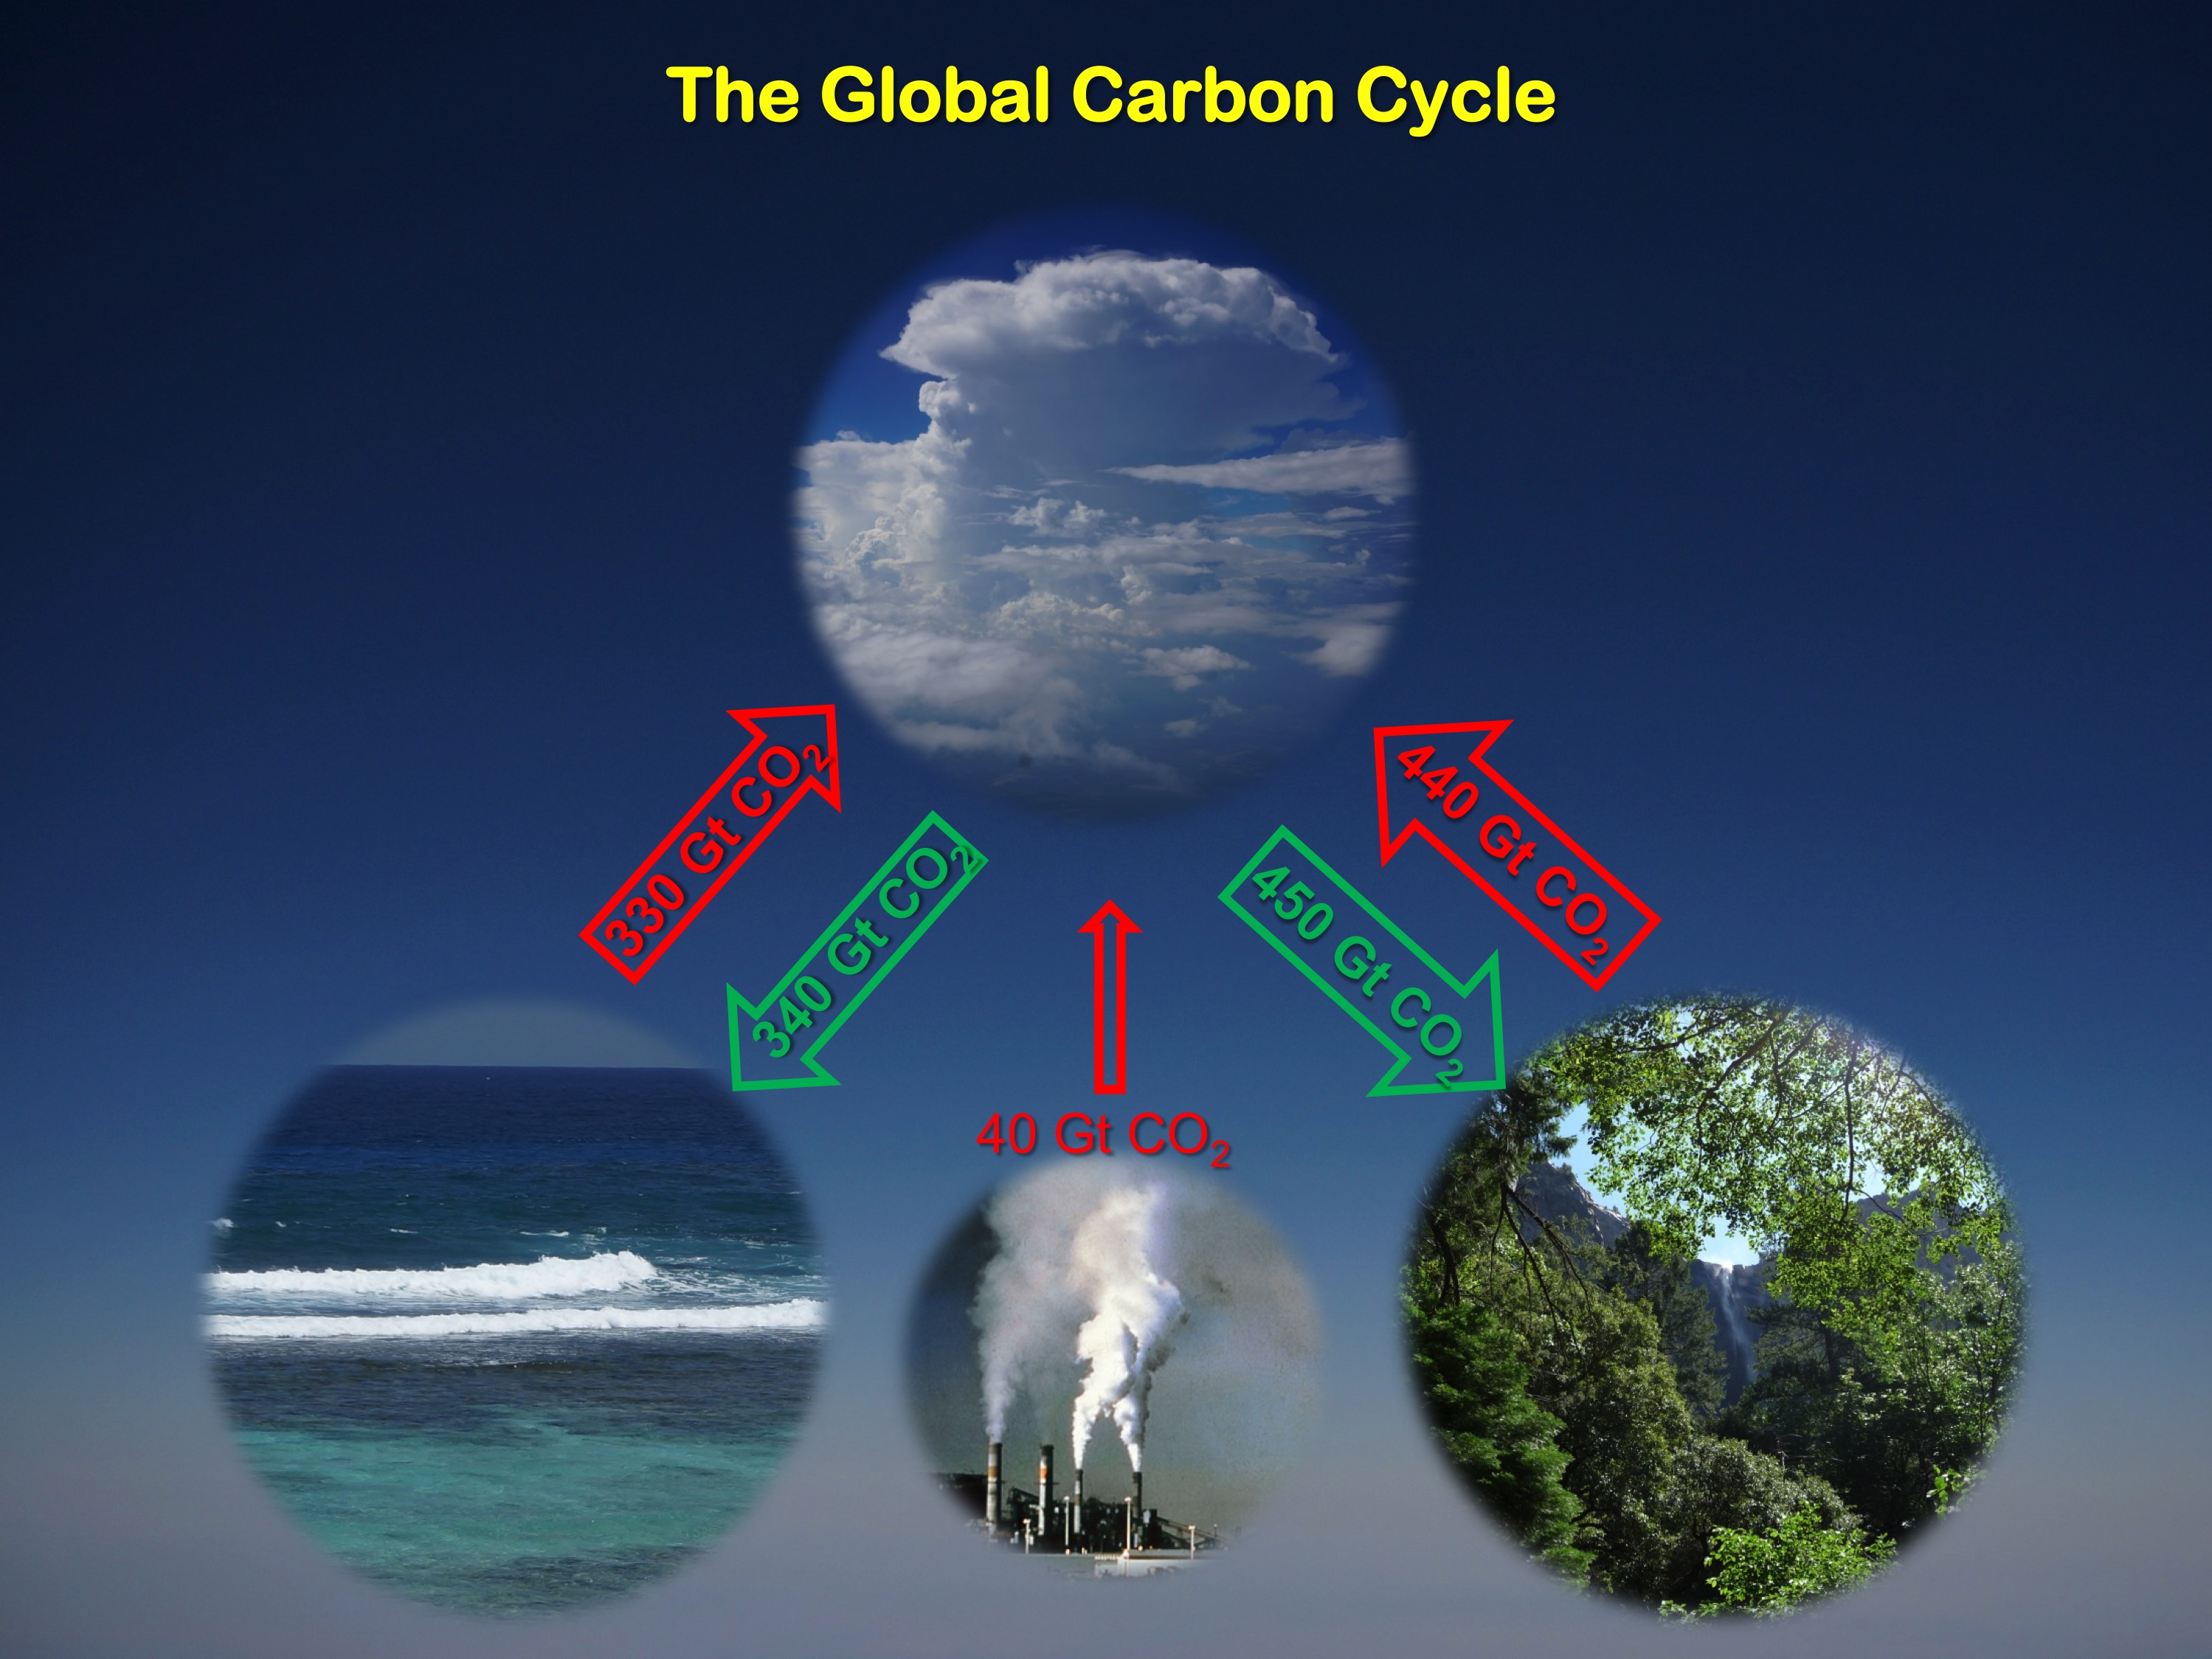
Figure 5 (Hurtt) --The ocean and land have continued to, over time, absorb about half of all carbon dioxide emissions, even as those emissions have risen dramatically in recent decades. It remains unclear if carbon absorption will continue at this rate.
Credit: NASA/JPL
Figure 6 (Hurtt) -- Satellite and field research has dramatically improved the resolution of scientists’ measurements of carbon stored by land ecosystems in recent decades and even in the past few years. NASA’s Carbon Monitoring System is in part targeting these improvements.
Credit: George Hurtt, University of Maryland
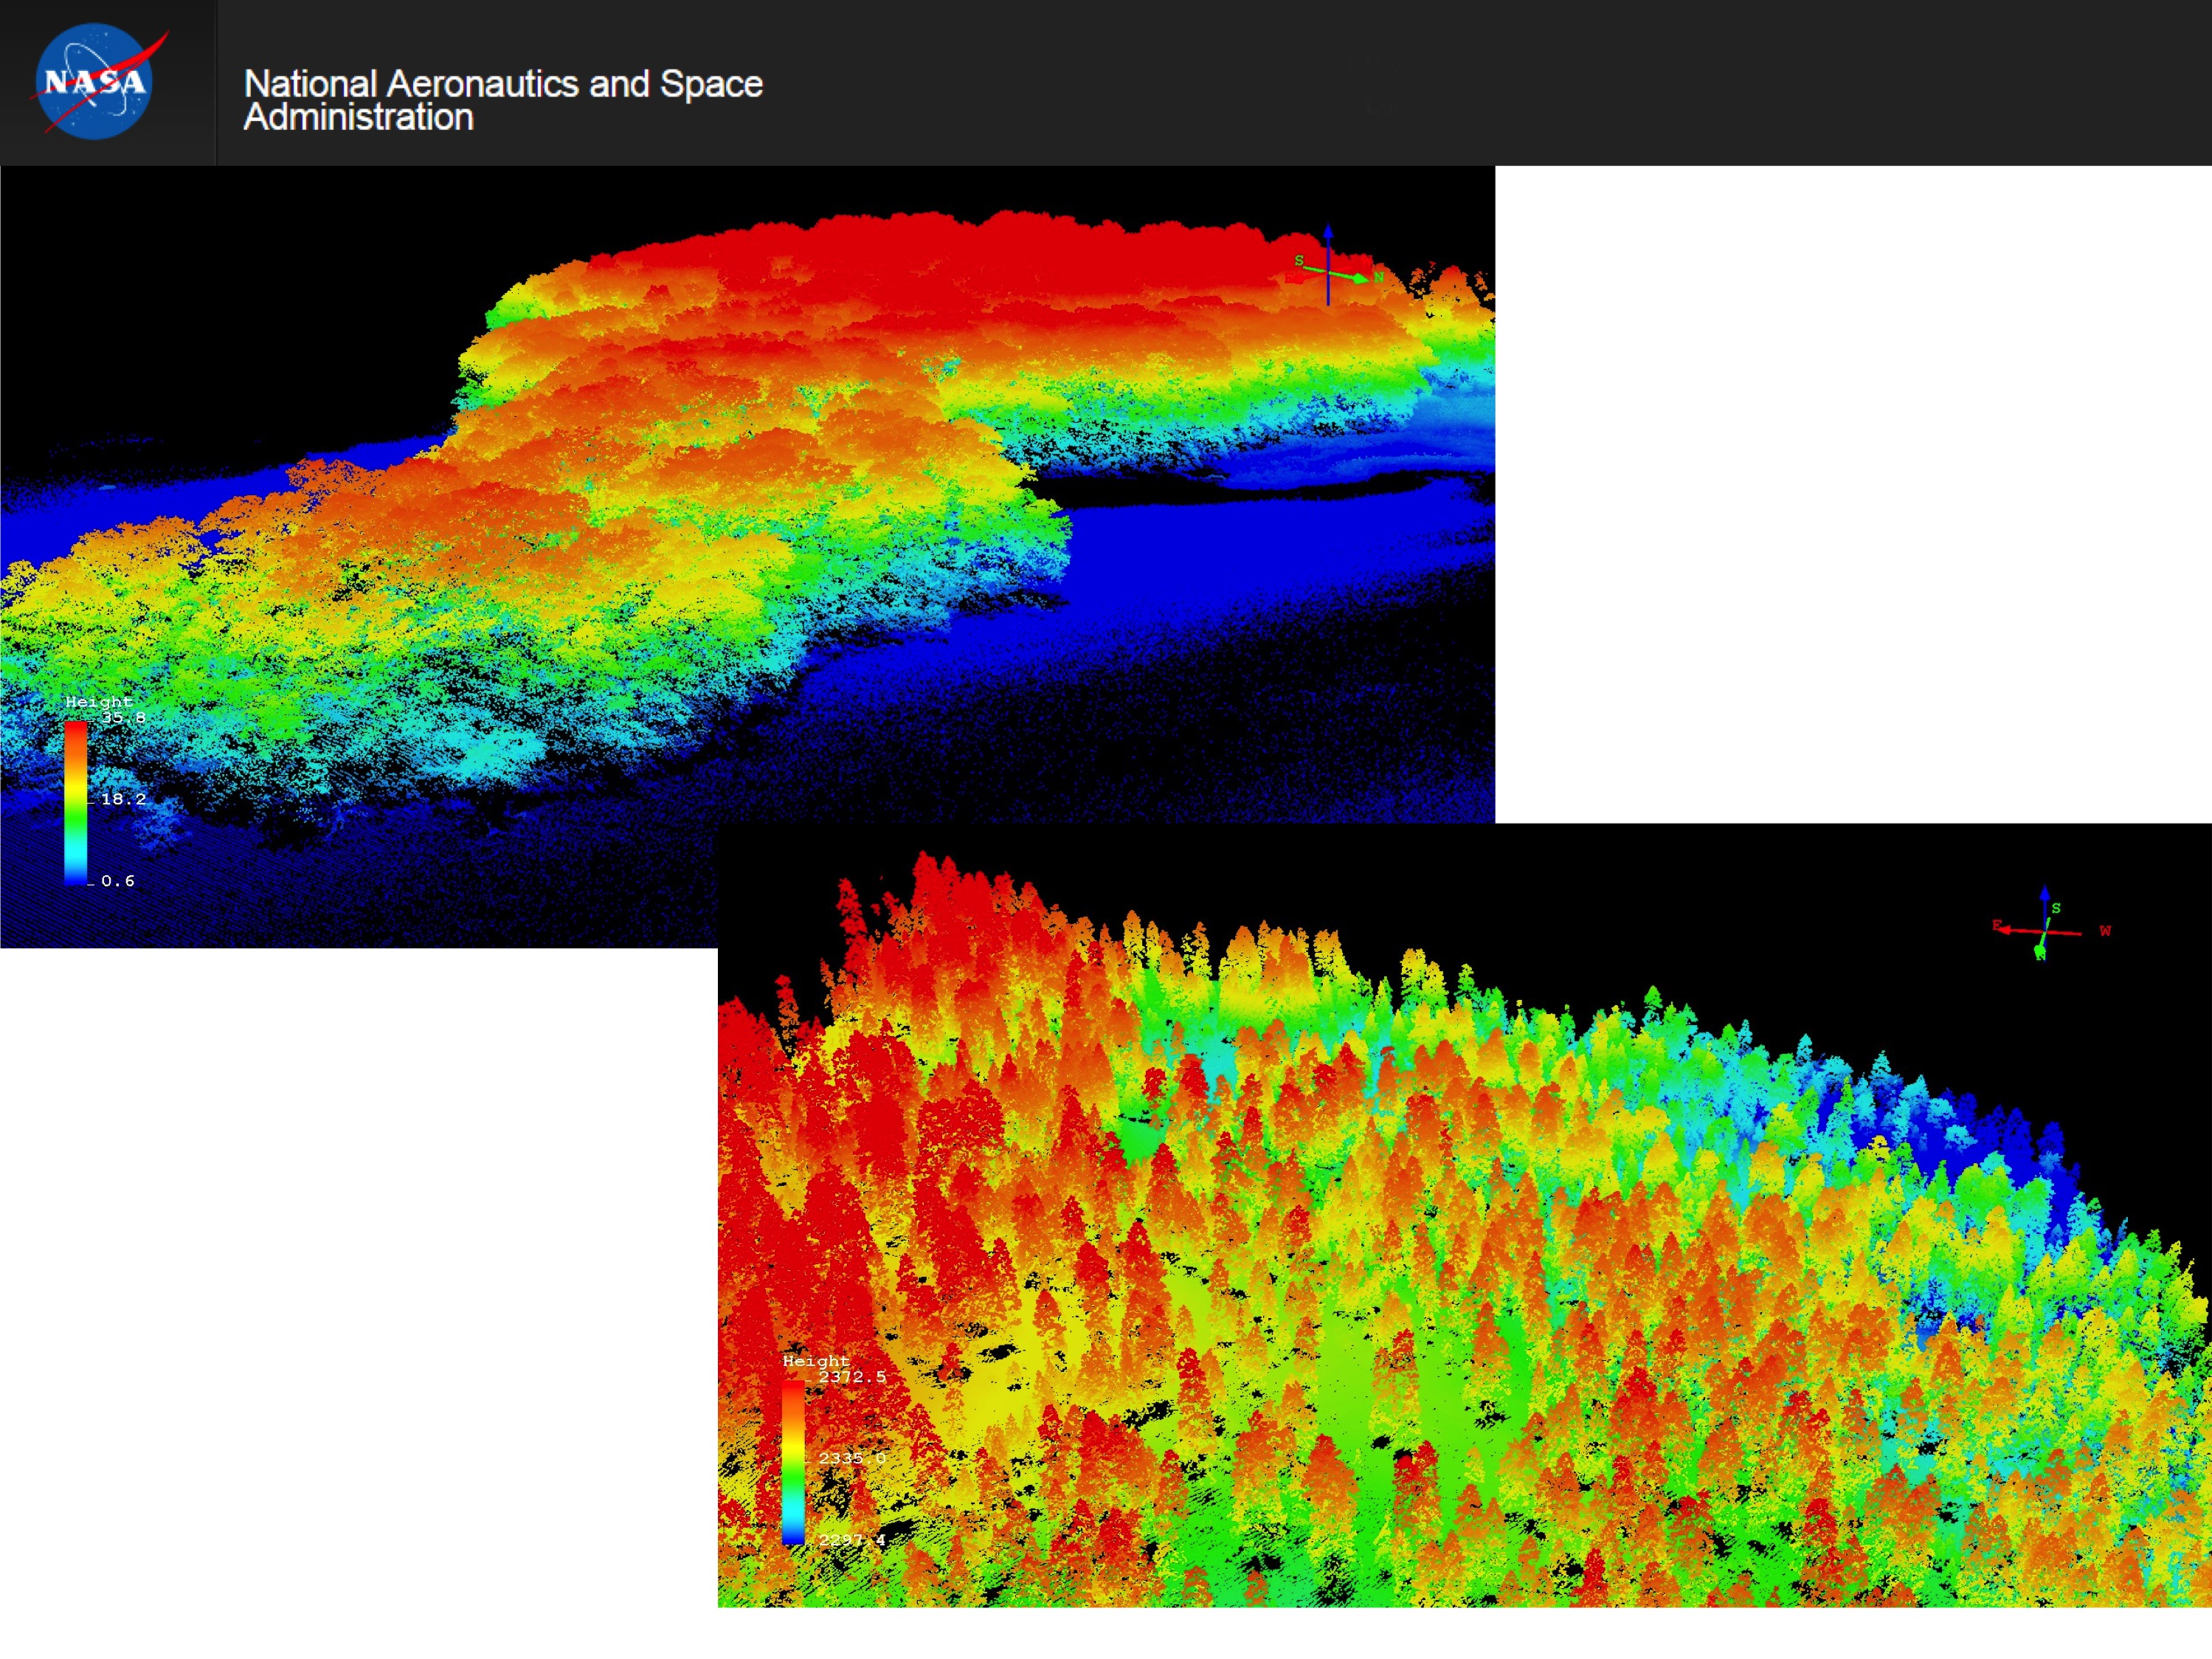
Figure 7 (Hurtt) -- Lidar measurements of forests are giving scientists better understanding of how and how much carbon is absorbed and stored by forests.
Credit: University of Maryland
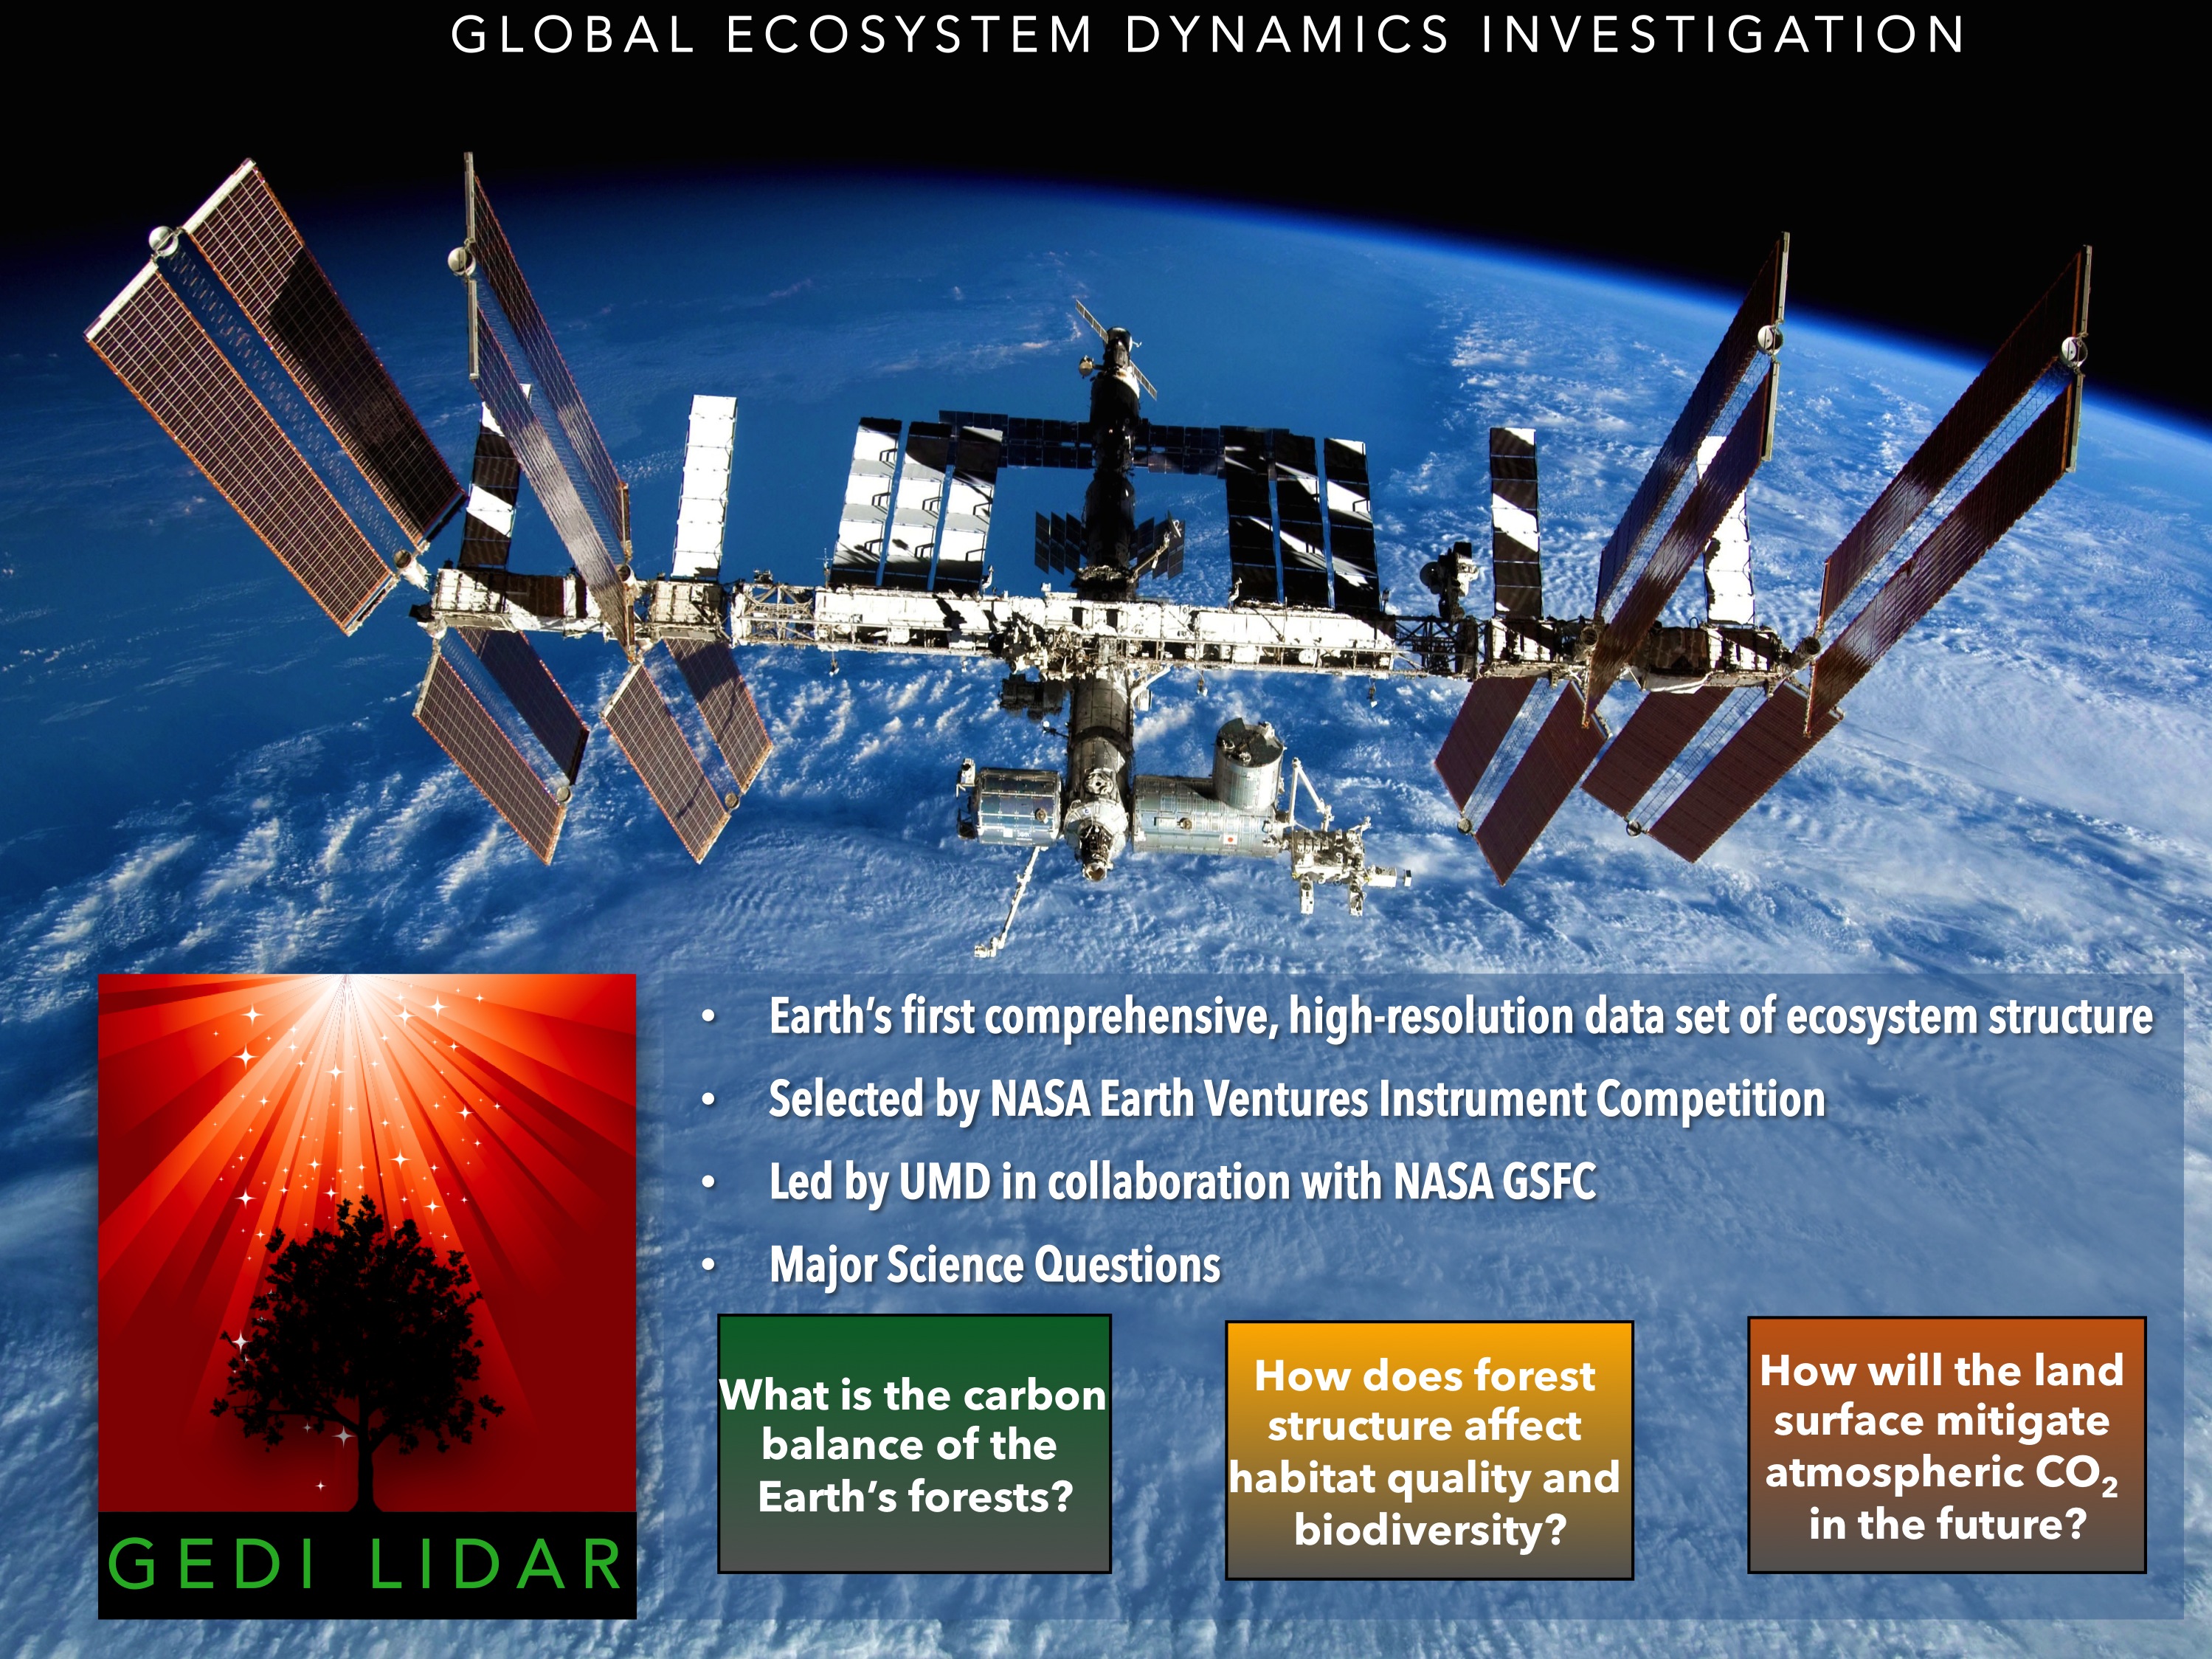
Figure 8 (Hurtt) -- The GEDI (Global Ecosystem Dynamics Investigation) lidar will fly on the International Space Station in coming years and provide 3-D observations of forest structure that will vastly improve measurements of carbon stored by trees.
Credit: Ralph Dubayah, University of Maryland
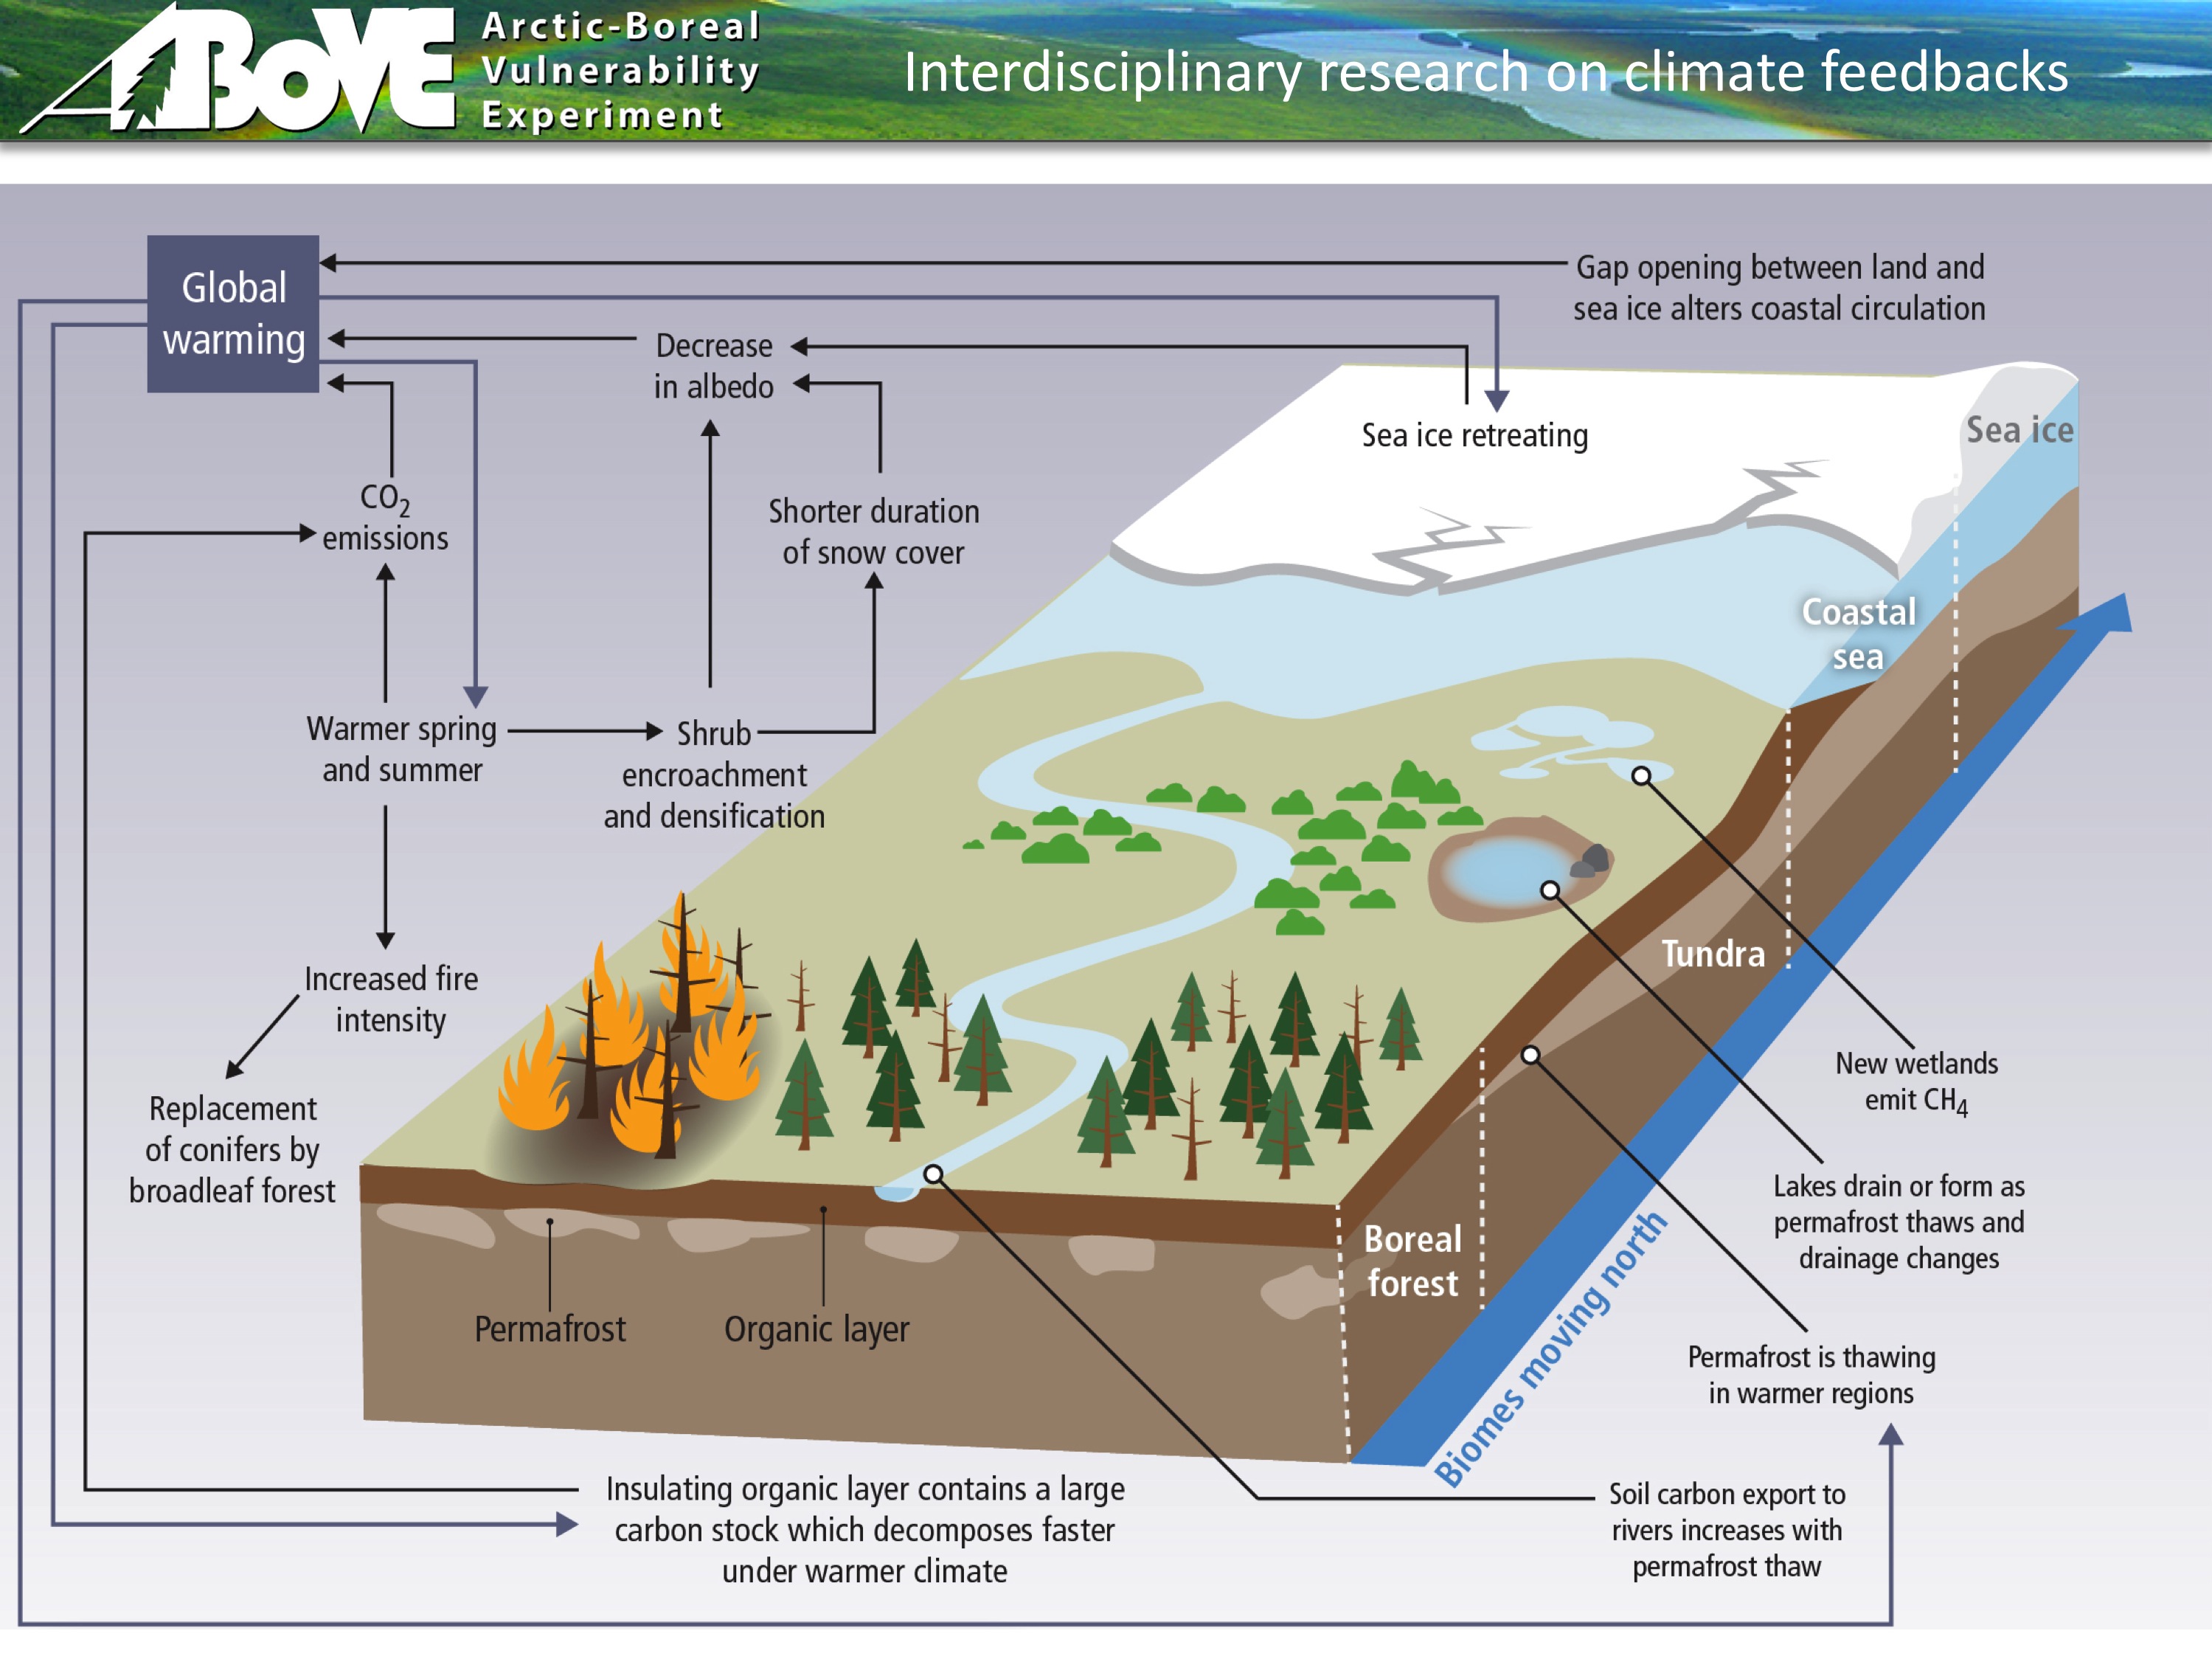
Figure 9 (Hurtt) -- In 2016, NASA will begin a 10-year field campaign using aircraft and on-the-ground monitoring in an attempt to gain better insight into how the rapidly warming Arctic could respond to climate change and potentially release methane and carbon dioxide to the atmosphere.
Credit: IPCC
Figure 10 (Eldering) -- The Orbiting Carbon Observatory-2 is providing NASA’s first detailed measurements of carbon dioxide in the atmosphere near Earth’s surface. OCO-2 recently released a first full year of data — critical to analyzing the annual cycle of carbon dioxide in the atmosphere.
Credit: NASA/JPL/Caltech

Figure 11 (Eldering) -- Part of the annual cycle can be seen here: In early Northern Hemisphere spring this year, concentrations above the equator exceeded 400 parts per million in many places.
Credit: NASA/JPL/Caltech
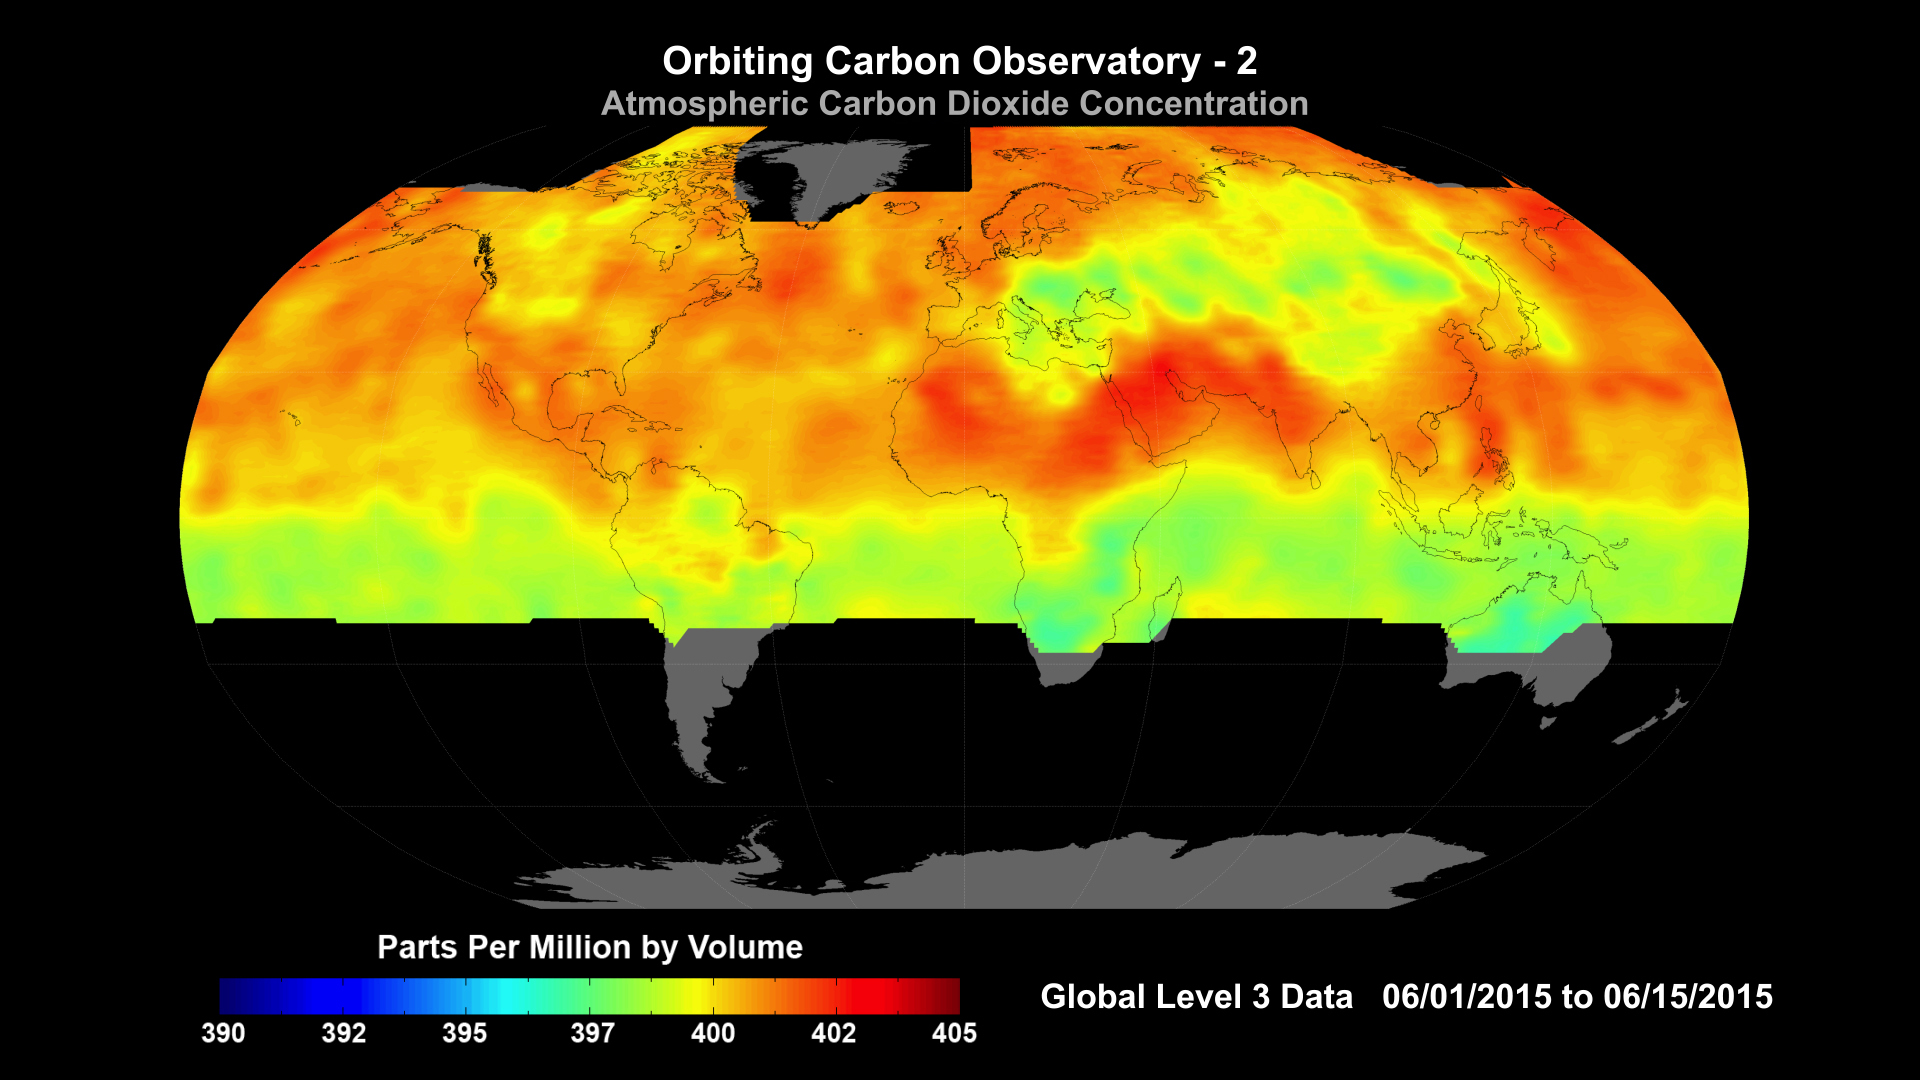
Figure 12 (Eldering) -- About two months later, after ocean and land plants had bloomed or leafed out, atmospheric concentrations have been drawn down via photosynthesis.
Credit: NASA/JPL/Caltech
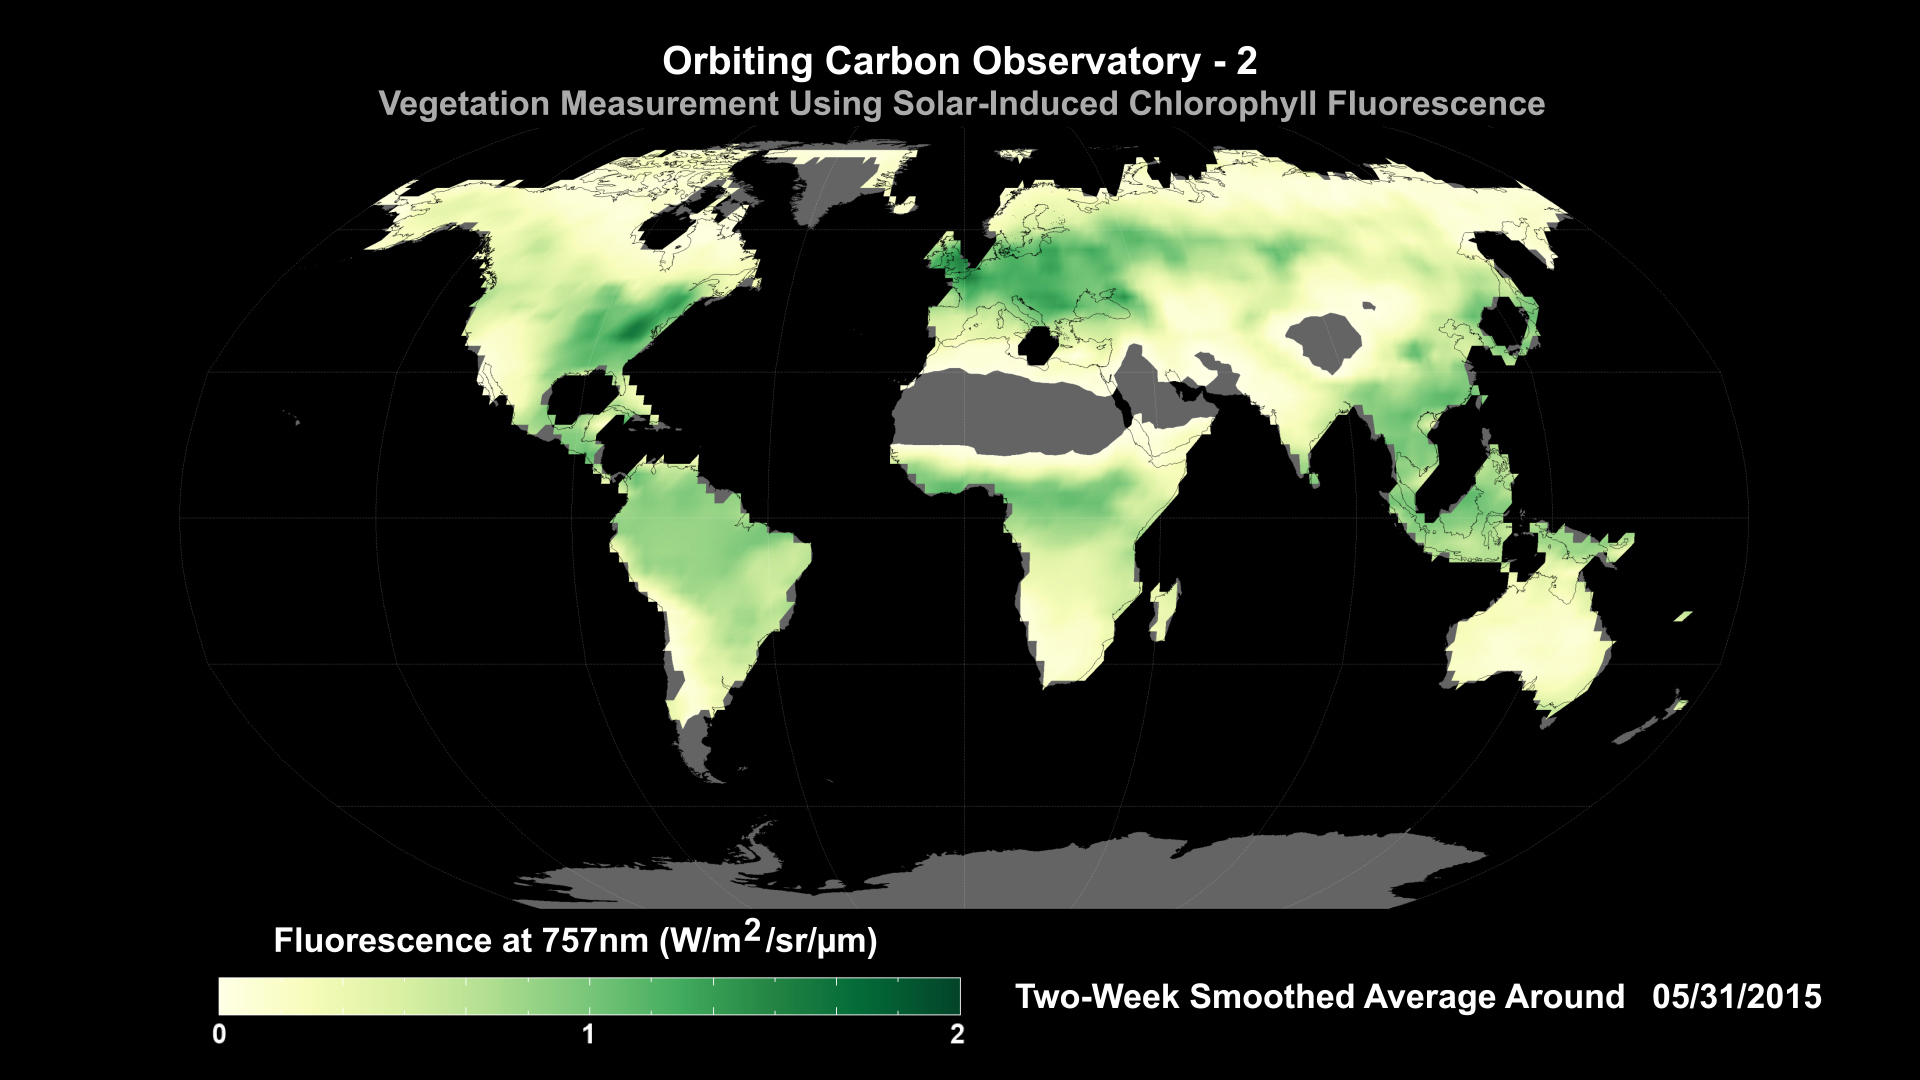
Figure 13 (Eldering) -- Though OCO-2 was not designed to do so, scientists have discovered they can use the instrument to measure plant fluorescence — a key sign of photosynthetic activity which could provide insights into carbon processes.
Credit: NASA/JPL/Caltech
Figure 14 (Ott) -- The GEOS-5 (Goddard Earth Observing System, Version 5) climate model has recently provided scientists with a higher resolution view of atmospheric processes than the most advanced weather forecasting models and with resolution 1,000 times greater than most climate models. Scientists are using it to study the “flux” of carbon between the atmosphere, land and ocean.
Credit: Global Modeling and Assimilation Office, NASA’s Goddard Space Flight Center
Figure 15 (Ott) -- Satellite measurements of phytoplankton in the ocean (ocean color), land greenness and even the brightness of city lights all go into climate models that help improve understanding of carbon flux.
Credit: Lesley Ott, NASA Goddard
Figure 16 (Ott) -- Climate models can replicate the day-to-night cycle of carbon’s absorption and release.
Credit: Lesley Ott, NASA Goddard
Figure 17 (Ott) -- This GEOS-5 simulation demonstrates how the model can distinguish between manmade sources of carbon dioxide emissions from megacities (blue) and natural sources, like fires.
Credit: Global Modeling and Assimilation Office, NASA’s Goddard Space Flight Center
Credits
Credits for each item listed with the individual item.
-
Producer
- Matthew R. Radcliff (USRA)
-
Science writer
- Patrick Lynch (Wyle Information Systems)
-
Scientists
- Michael Behrenfeld (Oregon State University)
- Lesley Ott (NASA/GSFC)
- George Hurtt (UMD)
- Annmarie Eldering (NASA/JPL CalTech)
Release date
This page was originally published on Thursday, November 12, 2015.
This page was last updated on Wednesday, May 3, 2023 at 1:49 PM EDT.
Missions
This visualization is related to the following missions:Related
- ID: 13799
![Music: Organic Machine by Bernhard Hering [GEMA] and Matthias Kruger [GEMA]Complete transcript available.](/vis/a010000/a013700/a013799/2020Temp.png) Produced Video
Produced Video - ID: 12057
 Produced Video
 - ID: 12047
 Produced Video