Sea Level Rise Briefing - August 26, 2015
Seas around the world have risen an average of nearly 3 inches since 1992, with some locations rising more than 9 inches due to natural variation, according to the latest satellite measurements from NASA and its partners. An intensive research effort now underway, aided by NASA observations and analysis, points to an unavoidable rise of several feet in the future.
Members of NASA’s new interdisciplinary Sea Level Change Team will discuss recent findings and new agency research efforts during a media teleconference on Aug. 26, 2015, at 12:30 p.m. EDT
The question scientists are grappling with is how quickly will seas rise?
Participating in the briefing:
Michael Freilich, director of NASA’s Earth Science Division at the agency’s headquarters in Washington
Steve Nerem, lead for NASA’s Sea Level Change Team at the University of Colorado in Boulder
Eric Rignot, glaciologist at the University of California, Irvine and NASA's Jet Propulsion Labratory (JPL) in Pasadena, California
Josh Willis, climate scientist at NASA’s JPL
For more information:
Rising Seas
Press Release: NASA Science Zeros in on Ocean Rise: How Much? How Soon?
Sea Level Rise Video Resources

Figure 1 (Nerem) -- Global sea level has been measured accurately and continuously by satellites since 1993.
Credit: Steve Nerem, University of Colorado
Figure 2 (Nerem) -- NASA’s Gravity Recovery and Climate Experiment (GRACE) twin satellites have measured the loss of ice mass from Earth’s polar ice sheets since 2002.
Credit: Nerem/CU-Boulder
Figure 3 (Nerem) -- As measured by the TOPEX/Jason satellites, sea level change in the short-term (top) and longer-term (bottom) can be very different.
Credit: Nerem
Figure 4 (Rignot) -- Laurence C. Smith, Chair of Geography at University of California, Los Angeles, deployed an autonomous drifter in a meltwater river on the surface of the Greenland ice sheet on July 19, 2015. The floating instrument was quickly swept away by the fast-moving glacial waters and ultimately swallowed by a moulin, a sinkhole in the ice. Although the scientists will never be able to recover the device from the depths of the ice sheet, the measurements it took and transmitted on its way down the waters will help scientists better understand how the network of streams and rivers that forms on the surface of the ice sheet when ice melts in the spring and summer contributes to sea level rise.
[CREDIT: NASA/Jefferson Beck]
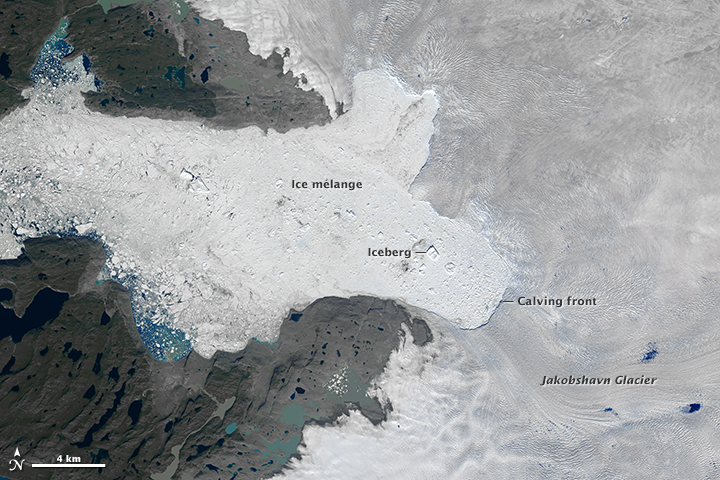
Figure 5 (Rignot) -- Greenland’s Jakobshavn Glacier, as seen on July 31, 2015, prior to a massive calving of ice in early August.
Credit: NASA’s Earth Observatory
Read more:
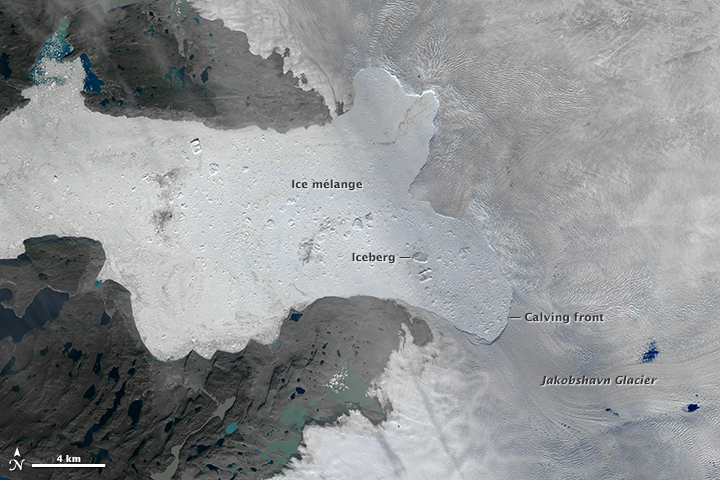
Figure 6 (Rignot) -- Jakobshavn, as seen on August 16, 2015. Credit: NASA’s Earth Observatory
Figure 7 (Rignot) -- NASA’s Operation IceBridge will make a series of flights over Greenland beginning in September with instruments outfitted on the agency’s HU-25C Guardian Falcon.
Credit: Operation IceBridge
Figure 8 (Willis) -- NASA’s new Oceans Melting Greenland (OMG) field campaign will use airborne and shipborne instruments in a six-year effort to better understand how warming ocean waters are interacting with the edge of the ice sheet.
Credit: Josh Willis/NASA JPL/OMG
Figure 9 (Willis) -- Preliminary data from OMG reveals the shape of the sea floor — a key factor in how ocean currents interact with the edges of the ice sheet — near Uummannaq.
Credit: Josh Willis/NASA JPL/OMG
Figure 10 (Willis) -- The TOPEX/Poisedon and Jason satellites have provided a 22-year and counting record of global sea level change.
Credit: NASA’s Scientific Visualization Studio
Figure 11 (Willis) -- A side-by-side comparison shows sea surface height in the Pacific Ocean during 2015, compared to 1997.
Credit: NASA JPL
Credits
Please give credit for this item to:
NASA's Goddard Space Flight Center
-
Technical support
- Swarupa Nune (InuTeq)
-
Editor
- Swarupa Nune (InuTeq)
-
Science writer
- Patrick Lynch (Wyle Information Systems)
Release date
This page was originally published on Wednesday, August 26, 2015.
This page was last updated on Wednesday, May 3, 2023 at 1:49 PM EDT.