Earth's Rising Seas

Satellite measurements show how sea level is changing around the world.
Earth’s rising seas are some of the most visible signs of our warming planet. Over the last 23 years, NASA satellite missions have observed a steady rise in global sea levels as polar ice sheets melt. Since 1992, seas around the world have risen an average of nearly 3 inches. As Earth continues to warm, new research suggests sea levels could rise by as much as several feet in the next 100 years. Sea level rise is one of the biggest environmental challenges of the 21st century, and NASA research is helping us understand how much our oceans will rise, and how fast that will happen. Watch the video to learn more.
Learn more about the causes of sea level rise and how sea level has changed over the last two decades in this video.
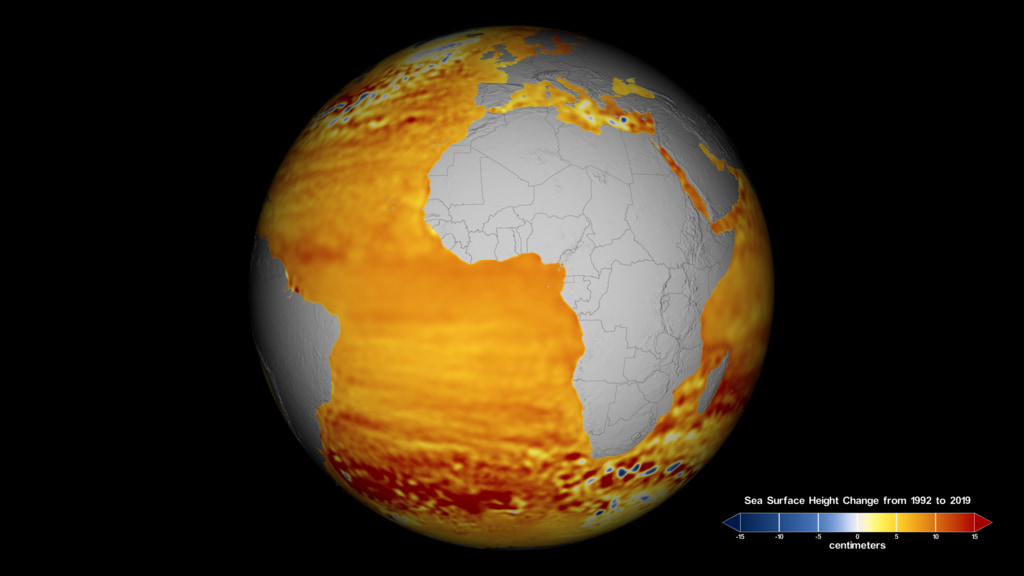
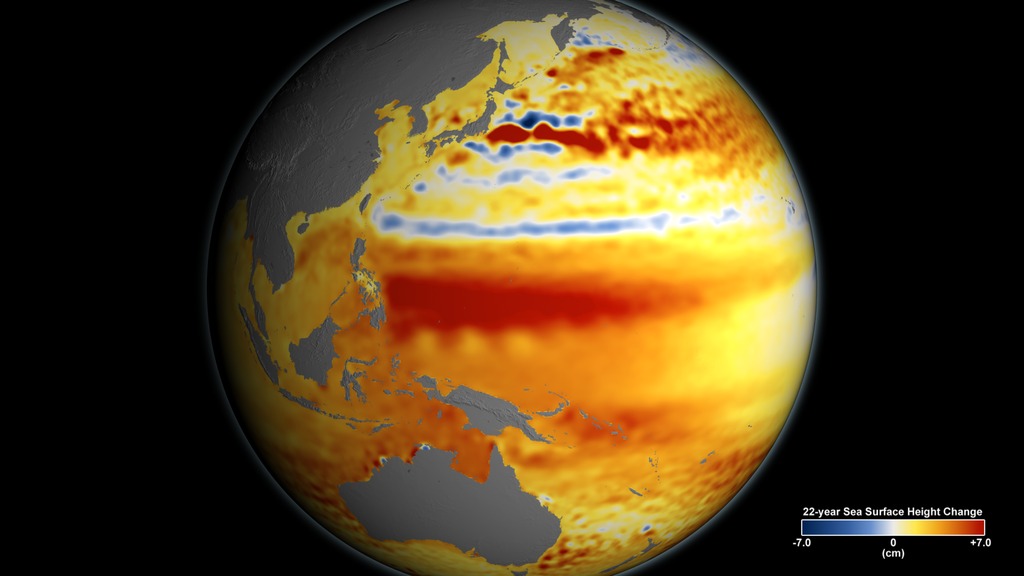
Sea level changes detected by satellites between 1992 and 2014 are shown on this map.
Cooling waters off the west coast of the U.S. have led to a drop in sea level in this part of the world.
Scientists attribute the rise in sea level in the western Pacific Ocean to winds and ocean currents piling up warm water in the region.
For More Information
See NASA.gov
Credits
Please give credit for this item to:
NASA's Goddard Space Flight Center
Images courtesy of NASA's Scientific Visualization Studio
Video courtesy of NASA/JPL
-
Writer
- Michelle Handleman (USRA)
-
Animator
- Kel Elkins (USRA)
-
Scientist
- Josh Willis (JPL)
-
Producer
- Patrick Lynch (Wyle Information Systems)
Release date
This page was originally published on Tuesday, September 1, 2015.
This page was last updated on Wednesday, May 3, 2023 at 1:49 PM EDT.
Related
- ID: 4853
 Visualization
 - ID: 4345
 Visualization