Supercomputer Simulations of Eta Carinae
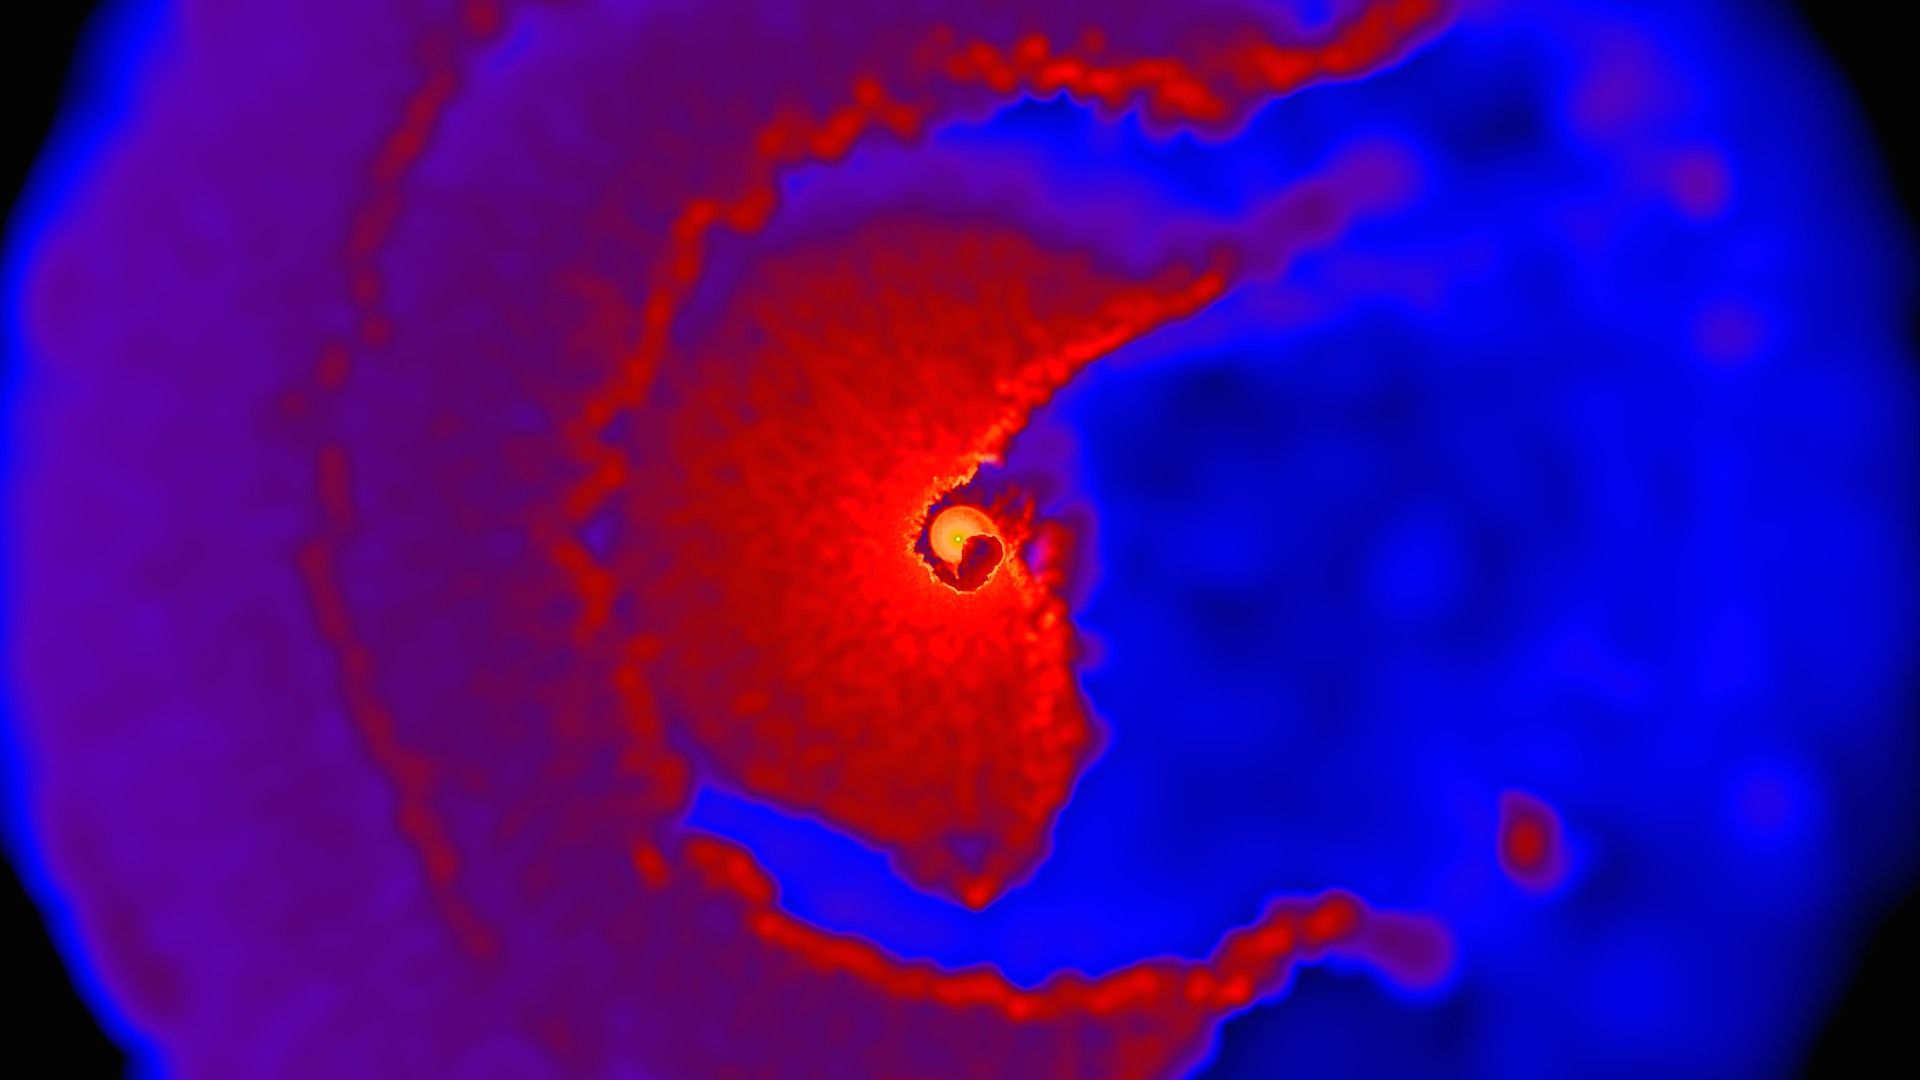
Density simulation. This movie shows a wide view of the system looking down on the orbital plane of the two stars, which are located at the center. The view spans 3,200 times the average distance between Earth and the sun, or 298 billion miles (478 billion kilometers). Lighter colors indicate greater densities, with the highest densities occurring near the primary and in the wind interaction region. The faster wind of the smaller star carves a spiral cavity into the dense wind of the primary star, and this structure expands outward with the primary wind at about 1 million mph (1.6 million km/h.
These movies show supercomputer simulations of the interactive stellar winds of Eta Carinae, a binary system that includes the most luminous and massive star within 10,000 light-years.
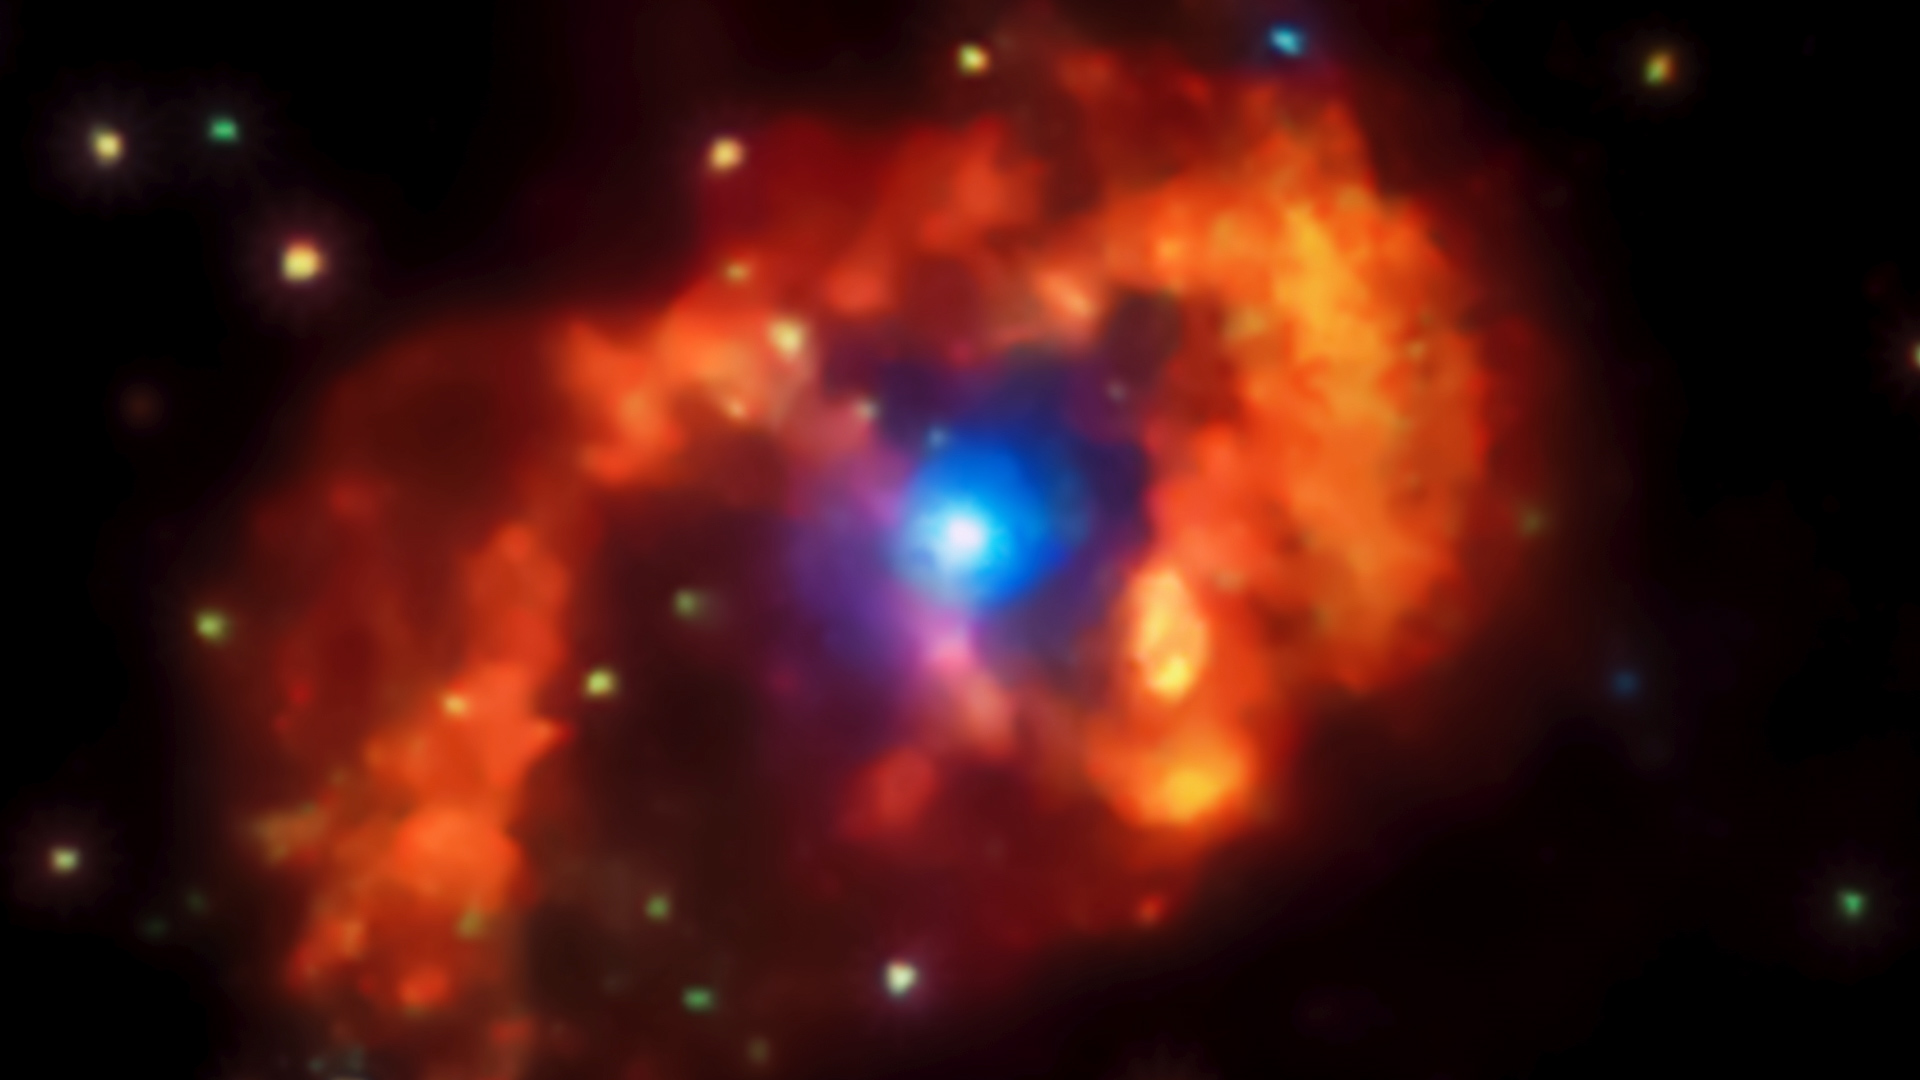
Both stars produce powerful gaseous outflows called stellar winds, which enshroud the stars and stymy efforts to directly measure their properties. Astronomers have established that the brighter, cooler primary star has about 90 times the mass of the sun and outshines it by 5 million times. While the properties of its smaller, hotter companion are more contested, Goddard's Ted Gull and his colleagues think the star has about 30 solar masses and emits a million times the sun's light.
During the past 11 years, spanning three close approaches or periastron passages, the Goddard group has developed a model based on routine observations of the stars using ground-based telescopes and multiple NASA satellites. According to this model, the interaction of the two stellar winds accounts for many of the periodic changes observed in the system. The winds from each star have markedly different properties: thick and slow for the primary, lean and fast for the hotter companion. The primary's wind blows at nearly 1 million mph (1.6 million km/h) and is especially dense, carrying away the equivalent mass of our sun every thousand years. By contrast, the companion's wind carries off about 100 times less material than the primary's, but it races outward as much as six times faster.
The 3-D time-dependent smoothed-particle hydrodynamics simulations, which were developed by Goddard theorist Thomas Madura, were performed on the Pleaides supercomputer at NASA's Ames Research Center in Moffett Field, California. The colors used relate either to density, temperature or wind speed differences, depending on the movie; see the captions for additional details.
Density simulation. Same as above, but looking into the orbital plane of the two stars (center).
Temperature simulation. This movie shows a wide view of the system looking down on the orbital plane of the two stars, which are located at the center. The view spans 3,200 times the average distance between Earth and the sun, or 298 billion miles (478 billion kilometers). Lighter colors indicate greater temperatures, with the highest temperatures -- reaching hundreds of millions of degrees -- occurring near the primary and in the wind interaction region.
Temperature simulation. Same as above, but looking into the orbital plane of the two stars (center).
Density simulation. We are looking down on the orbital plane of the two stars (center). The view spans 320 times the average distance between Earth and the sun, or 29.8 billion miles (47.8 billion km). Lighter colors indicate greater densities, with the highest densities occurring near the primary and in the wind interaction region. The faster wind of the smaller star carves a spiral cavity into the dense wind of the primary star, and this structure expands outward with the primary wind at about 1 million mph (1.6 million km/h).
Density simulation. Same as above, but looking into the orbital plane of the two stars (center).
Temperature simulation. This movie shows a wide view of the system looking down on the orbital plane of the two stars, which are located at the center. The view spans 320 times the average distance between Earth and the sun, or 29.8 billion miles (47.8 billion km). Lighter colors indicate greater temperatures, with the highest temperatures -- reaching hundreds of millions of degrees -- occurring near the primary and in the wind interaction region.
Temperature simulation. Same as above, but looking into the orbital plane of the two stars (center).
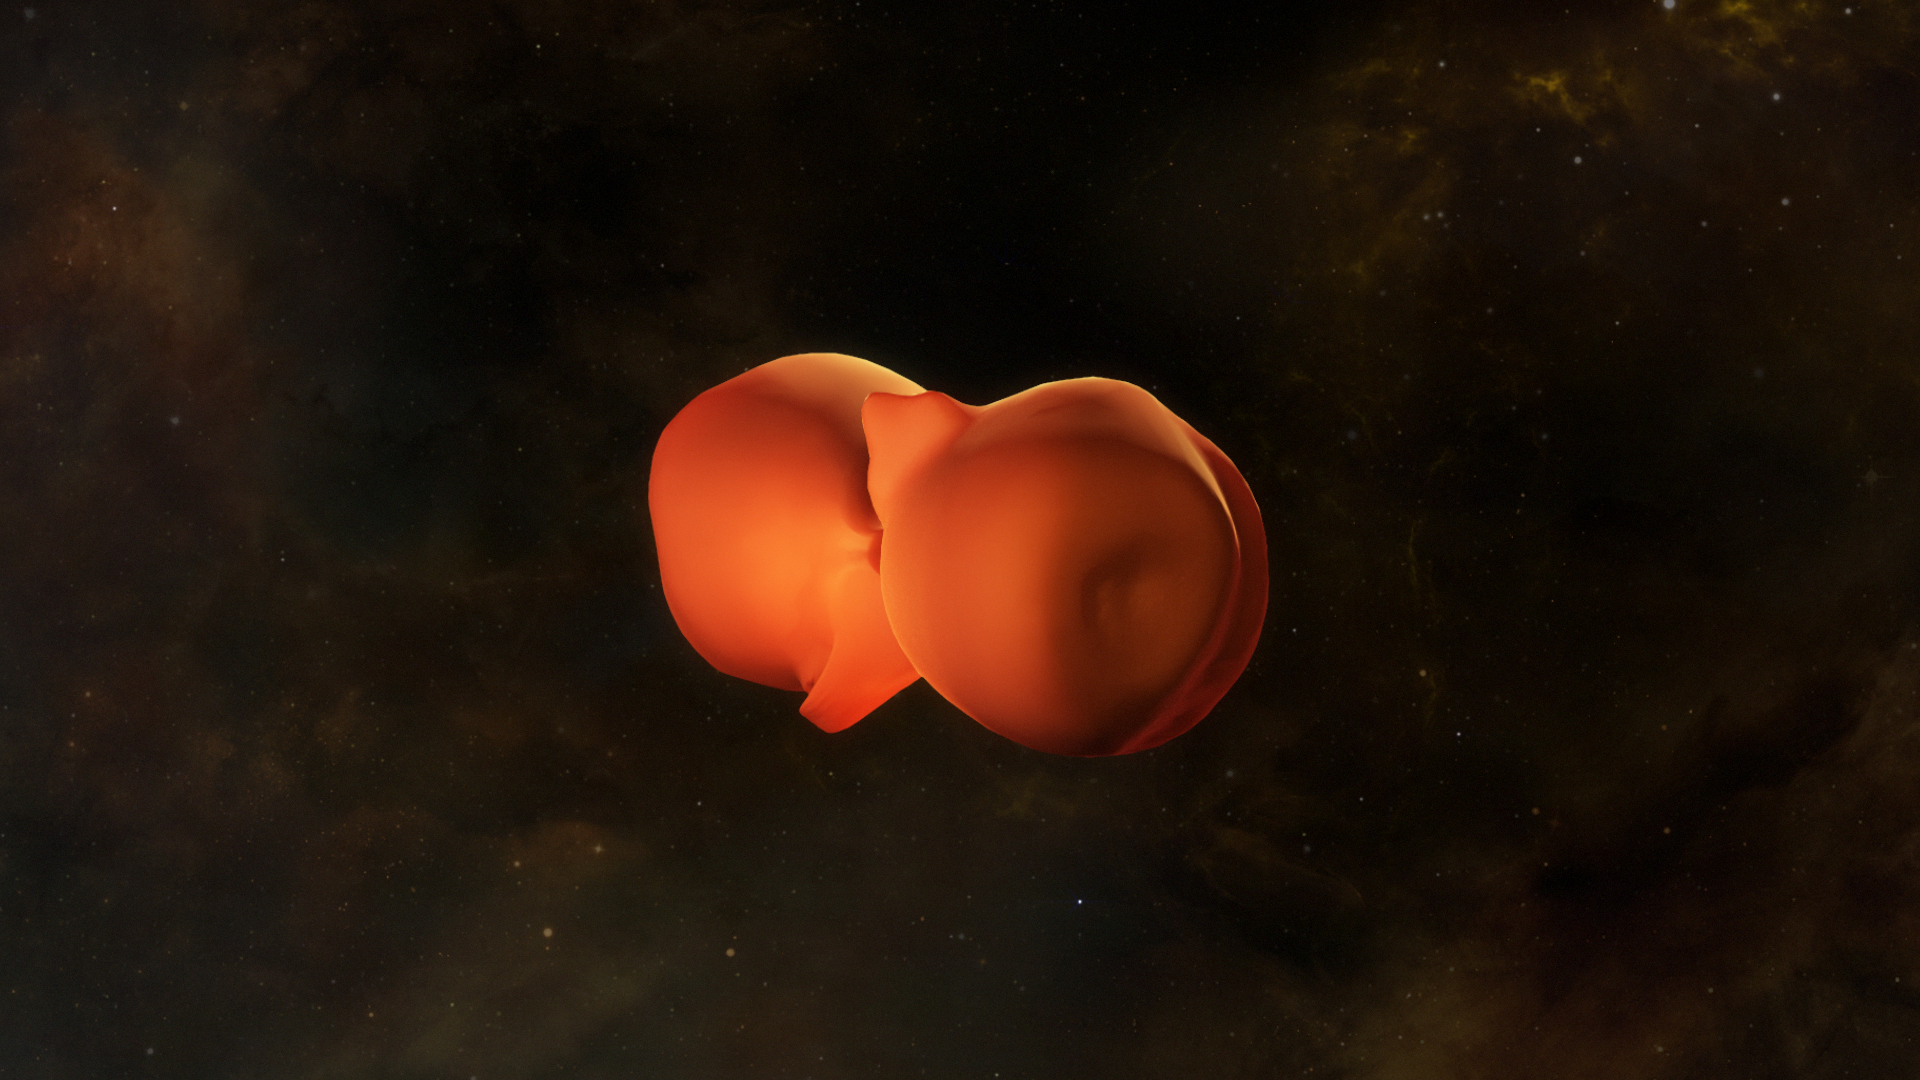
Density simulation. We are looking down on the orbital plane of the two stars (represented by black circles) during the months before and after their closest approach. Lighter colors indicate greater densities, with the highest densities occurring near the primary and in the wind interaction region. The faster wind of the smaller star carves a spiral cavity into the dense wind of the primary star, and this structure expands outward with the primary wind at about 1 million mph (1.6 million km/h). The view spans 20 times the average distance between Earth and the sun, or 1.9 billion miles (2.9 billion km), comparable to the diameter of Saturn's orbit in our solar system.
Density simulation. Same as above, but looking into the orbital plane of the two stars (only the primary, represented by a black circle, can be seen briefly).
Temperature simulation. We are looking down on the orbital plane of the two stars (represented by black circles) during the months before and after their closest approach. Lighter colors indicate greater temperatures, with the highest temperatures -- reaching hundreds of millions of degrees -- occurring along the boundary of the wind interaction region. The view spans 20 times the average distance between Earth and the sun, or 1.9 billion miles (2.9 billion km), comparable to the diameter of Saturn's orbit in our solar system.
Temperature simulation. Same as above, but looking into the orbital plane of the two stars (only the primary, represented by a black circle, can be seen briefly).
Wind speed simulation. We are looking down on the orbital plane of the two stars (represented by black circles) during the months before and after their closest approach. Lighter colors indicate greater gas velocities. The fastest speeds, which are associated with the unimpeded flow of the secondary's stellar wind into the spiral cavity it created, exceed 6 million mph (10 million km/h or 3,000 km/s). The view spans 20 times the average distance between Earth and the sun, or 1.9 billion miles (2.9 billion km), comparable to the diameter of Saturn's orbit in our solar system.
Wind speed simulation. Same as above, but looking into the orbital plane of the two stars (only the primary, represented by a black circle, can be seen briefly).
The combined view of density and temperature is set up for viewing on the hyperwall. The view spans 3,200 times the average distance between Earth and the sun, or 298 billion miles (478 billion kilometers).
For More Information
Credits
Please give credit for this item to:
NASA's Goddard Space Flight Center/T. Madura
-
Animator
- Thomas Madura (ORAU)
-
Writer
- Francis Reddy (Syneren Technologies)
-
Producer
- Scott Wiessinger (USRA)
Release date
This page was originally published on Wednesday, January 7, 2015.
This page was last updated on Tuesday, November 14, 2023 at 12:19 AM EST.
Series
This visualization can be found in the following series:Tapes
This visualization originally appeared on the following tapes:-
Eta Carinae Inner Workings
(ID: 2015001)
Tuesday, January 6, 2015 at 5:00AM
Produced by - Robert Crippen (NASA)
Related
- ID: 11725
- ID: 11568
 Produced Video
Used as a Source In
- ID: 12989
 Produced Video