Simulating Carbon
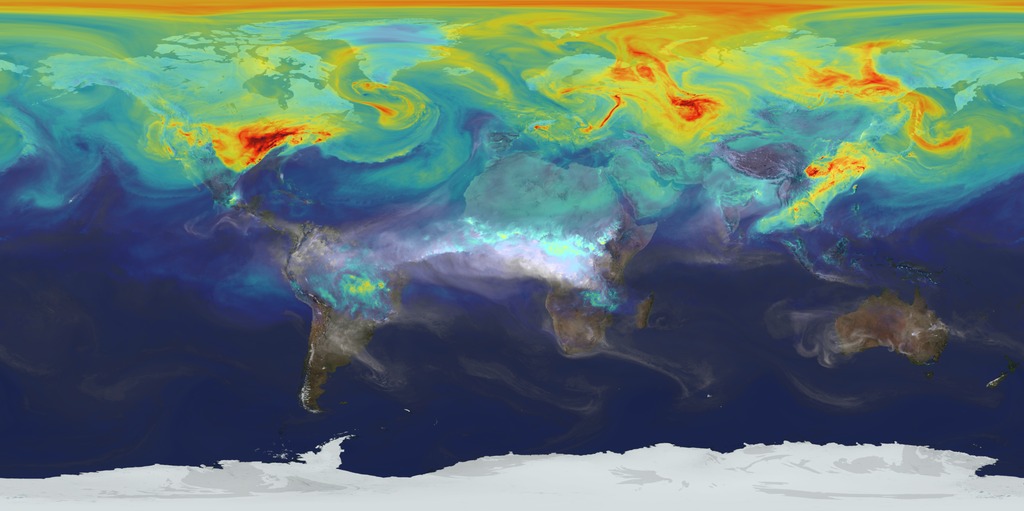
Carbon dioxide is the key driver of global warming, however, despite its significance, much remains unknown about the pathways it takes from emission source to the atmosphere or carbon reservoirs such as oceans and forests. Using a NASA supercomputer model called GEOS-5, scientists created a visualization that simulates how the greenhouse gas travels through Earth’s atmosphere over the course of a year. The model run produced nearly four petabytes (million billion bytes) of data and required 75 days of dedicated computation to complete. In addition to providing a striking look at the movements of the invisible gas as it is transported by winds across the globe, the visualization illustrates differences in carbon dioxide levels in the Northern and Southern Hemispheres and distinct swings in global carbon dioxide concentrations as the growth cycle of plants and trees changes with the seasons. Watch the video for a tour of the visualization.

A NASA supercomputer model provides a new portrait of the greenhouse gas.
NASA climate scientist Bill Putman explains the nuances of carbon dioxide's movements and fluctuations throughout a year in this video.
Carbon dioxide levels in the Northern Hemisphere rise during winter, reaching a peak in spring.
Levels sharply decline in the summer as plant life flourishes across the Northern Hemisphere.
During fall, the gas begins to accumulate over industrial countries in the Northern Hemisphere as absorption by plants decreases.
By winter, concentrations of the greenhouse gas again climb toward their annual peak—this time at a higher level than the previous year.
For More Information
See NASA.gov
Credits
Please give credit for this item to:
NASA's Goddard Space Flight Center
-
Animator
- William Putman (NASA/GSFC)
-
Video editor
- Kayvon Sharghi (USRA)
-
Narration
- William Putman (NASA/GSFC)
- Kayvon Sharghi (USRA)
-
Narrator
- William Putman (NASA/GSFC)
-
Producer
- Kayvon Sharghi (USRA)
-
Scientist
- William Putman (NASA/GSFC)
-
Writer
- Patrick Lynch (Wyle Information Systems)
Release date
This page was originally published on Tuesday, November 18, 2014.
This page was last updated on Wednesday, May 3, 2023 at 1:50 PM EDT.
Related
- ID: 11719
 Produced Video