Sun Emits 3 X-class Flares in 2 Days
The sun emitted a significant solar flare, peaking at 7:42 a.m. EDT on June 10, 2014. NASA's Solar Dynamics Observatory – which typically observes the entire sun 24 hours a day — captured images of the flare.
This flare is classified as an X2.2 flare. X-class denotes the most intense flares, while the number provides more information about its strength. An X2 is twice as intense as an X1, an X3 is three times as intense, etc.
About one hour later, the sun released a second X-class flare, peaking at 8:52 a.m. EDT on June 10, 2014. This is classified as an X1.5 flare.
This video shows both X-class flares from June 10, 2014.
Credit: NASA/SDO/Goddard

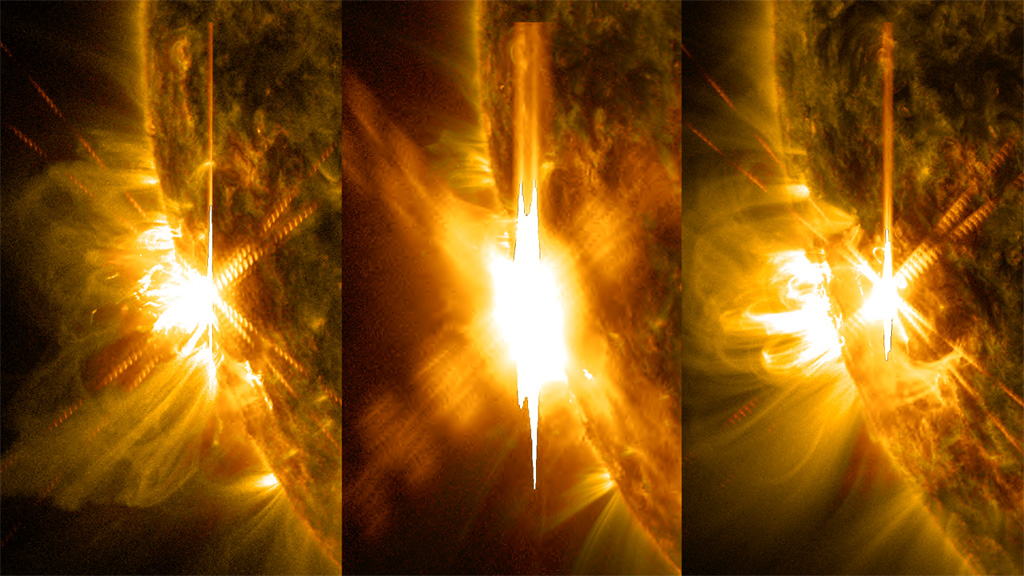
Three X-class flares erupted from the left side of the sun June 10-11, 2014. These images are from NASA's Solar Dynamics Observatory and show light in a blend of two ultraviolet wavelengths: 171 and 131 angstroms. The former is colorized in yellow, the latter in red.
Image Credit: NASA/SDO/Goddard
Three X-class flares erupted from the left side of the sun June 10-11, 2014. These images are from NASA's Solar Dynamics Observatory and show light in a blend of two ultraviolet wavelengths: 171 and 131 angstroms. The former is colorized in yellow, the latter in red. No text.
Image Credit: NASA/SDO/Goddard
A solar flare bursts off the left limb of the sun in this image captured by NASA's Solar Dynamics Observatory on June 11, 2014, at 9:05 a.m. EDT. This is classified as an X1.0 flare, shown in a blend of two wavelengths of light: 171 and 131 angstroms, colorized in gold and red, respectively. Cropped.
Image Credit: NASA/SDO/Goddard
A solar flare bursts off the left limb of the sun in this image captured by NASA's Solar Dynamics Observatory on June 11, 2014, at 9:05 a.m. EDT. This is classified as an X1.0 flare, shown in a blend of two wavelengths of light: 171 and 131 angstroms, colorized in gold and red, respectively.
Image Credit: NASA/SDO/Goddard
A solar flare bursts off the left limb of the sun in this image captured by NASA's Solar Dynamics Observatory on June 10, 2014, at 8:55 a.m. EDT. This is classified as an X1.5 flare, shown in a blend of two wavelengths of light: 171 and 131 angstroms, colorized in gold and red, respectively.
Image Credit: NASA/SDO/Goddard
A solar flare bursts off the left limb of the sun in this image captured by NASA's Solar Dynamics Observatory on June 10, 2014, at 7:41 a.m. EDT. This is classified as an X2.2 flare, shown in a blend of two wavelengths of light: 171 and 131 angstroms, colorized in gold and red, respectively. Cropped.
Image Credit: NASA/SDO/Goddard/Wiessinger
A solar flare bursts off the left limb of the sun in this image captured by NASA's Solar Dynamics Observatory on June 10, 2014, at 7:41 a.m. EDT. This is classified as an X2.2 flare, shown in a blend of two wavelengths of light: 171 and 131 angstroms, colorized in gold and red, respectively.
Image Credit: NASA/SDO/Goddard/Wiessinger
The first X-class flare of June 10, 2014, appears as a bright flash on the left side of this image from NASA’s Solar Dynamics Observatory. This image shows light in the 131-angstrom wavelength, which is typically colorized in teal. It was captured at 7:41 a.m EDT.
Image Credit: NASA/SDO
The first X-class flare of June 10, 2014, appears as a bright flash on the left side of this image from NASA’s Solar Dynamics Observatory. This image shows light in the 171-angstrom wavelength, which is typically colorized in gold. It was captured at 7:41 a.m EDT.
Image Credit: NASA/SDO
The second X-class flare of June 10, 2014, appears as a bright flash on the left side of this image from NASA’s Solar Dynamics Observatory. This image shows light in the 131-angstrom wavelength, which is typically colorized in teal. It was captured at 8:57 a.m EDT, just after the flare peaked.
Image Credit: NASA/SDO
The second X-class flare of June 10, 2014, appears as a bright flash on the left side of this image from NASA’s Solar Dynamics Observatory. This image shows light in the 193-angstrom wavelength, which is typically colorized in yellow. It was captured at 8:55 a.m EDT, just after the flare peaked.
Image Credit: NASA/SDO
4k video and frames of the first two flares in 131 angstrom light.
Credit: NASA/Goddard/SDO
4k video and frames of the first two flares in 171 angstrom light.
Credit: NASA/Goddard/SDO
4k video and frames of the first two flares in 304 angstrom light.
Credit: NASA/Goddard/SDO
For More Information
Credits
Please give credit for this item to:
NASA's Goddard Space Flight Center. However, individual images should be credited as indicated above.
-
Animator
- Tom Bridgman (Global Science and Technology, Inc.)
-
Video editor
- Scott Wiessinger (USRA)
-
Producers
- Scott Wiessinger (USRA)
- Genna Duberstein (USRA)
-
Project support
- Aaron E. Lepsch (ADNET Systems, Inc.)
-
Writer
- Karen Fox (ADNET Systems, Inc.)
Release date
This page was originally published on Tuesday, June 10, 2014.
This page was last updated on Wednesday, May 3, 2023 at 1:50 PM EDT.
Missions
This visualization is related to the following missions:Series
This visualization can be found in the following series:Tapes
This visualization originally appeared on the following tapes:-
2014 Heliophysics Breaking News
(ID: 2014015)
Tuesday, December 30, 2014 at 5:00AM
Produced by - Robert Crippen (NASA)
Datasets used in this visualization
-
[SDO]
ID: 168This dataset can be found at: http://sdo.gsfc.nasa.gov/
See all pages that use this dataset -
AIA 304 (304 Filter) [SDO: AIA]
ID: 677This dataset can be found at: http://jsoc.stanford.edu/
See all pages that use this dataset -
AIA 171 (171 Filter) [SDO: AIA]
ID: 680This dataset can be found at: http://jsoc.stanford.edu/
See all pages that use this dataset -
AIA 131 (131 Filter) [SDO: AIA]
ID: 730This dataset can be found at: http://jsoc.stanford.edu/
See all pages that use this dataset
Note: While we identify the data sets used in these visualizations, we do not store any further details, nor the data sets themselves on our site.
Related
- ID: 11589
 Produced Video