NASA On Air: NASA's Aquarius Measures Ocean Salinity (3/13/2014)
Movies
- WC_Aquarius-1920-MASTER.webmhd.webm (960x540) [6.7 MB]
- WC_Aquarius-1920-MASTER_iPad_960x540.m4v (960x540) [58.1 MB]
- WC_Aquarius-1920-MASTER_WEA_CEN.wmv (1280x720) [16.5 MB]
- WC_Aquarius-1920-MASTER_iPad_1280x720.m4v (1280x720) [90.3 MB]
- WC_Aquarius-1920-MASTER_1280x720.mov (1280x720) [653.6 MB]
- WC_Aquarius-1920-MASTER_prores.avi (1280x720) [18.3 MB]
- WC_Aquarius-1920-MASTER_iPad_1920x0180.m4v (1920x1080) [170.8 MB]
- WC_Aquarius-1920-MASTER_1920x1080.mov (1920x1080) [562.4 MB]
- WC_Aquarius-1920-MASTER_baron.mp4 (1920x1080) [23.4 MB]
- WC_Aquarius-1920-MASTER_prores.mov (1920x1080) [555.3 MB]
- WC_Aquarius-1920-MASTER_NBC_Today.mov (1920x1080) [170.8 MB]
Images
- Aquarius.jpg (1920x1080) [893.5 KB]
- Aquarius_thm.png (80x40) [4.5 KB]
- Aquarius_web.png (320x180) [51.3 KB]
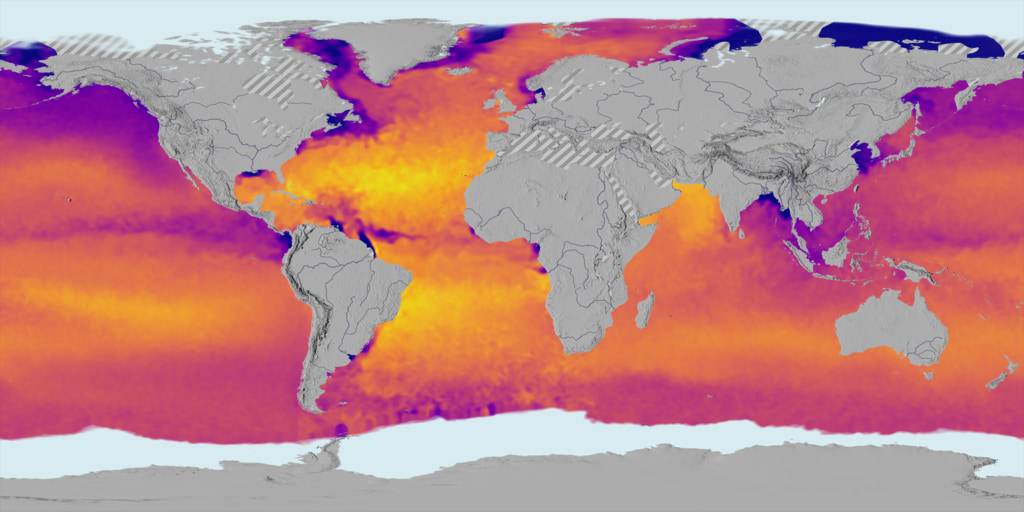
LEAD: NASA's Aquarius instrument is observing the saltiness of the ocean surface from space.
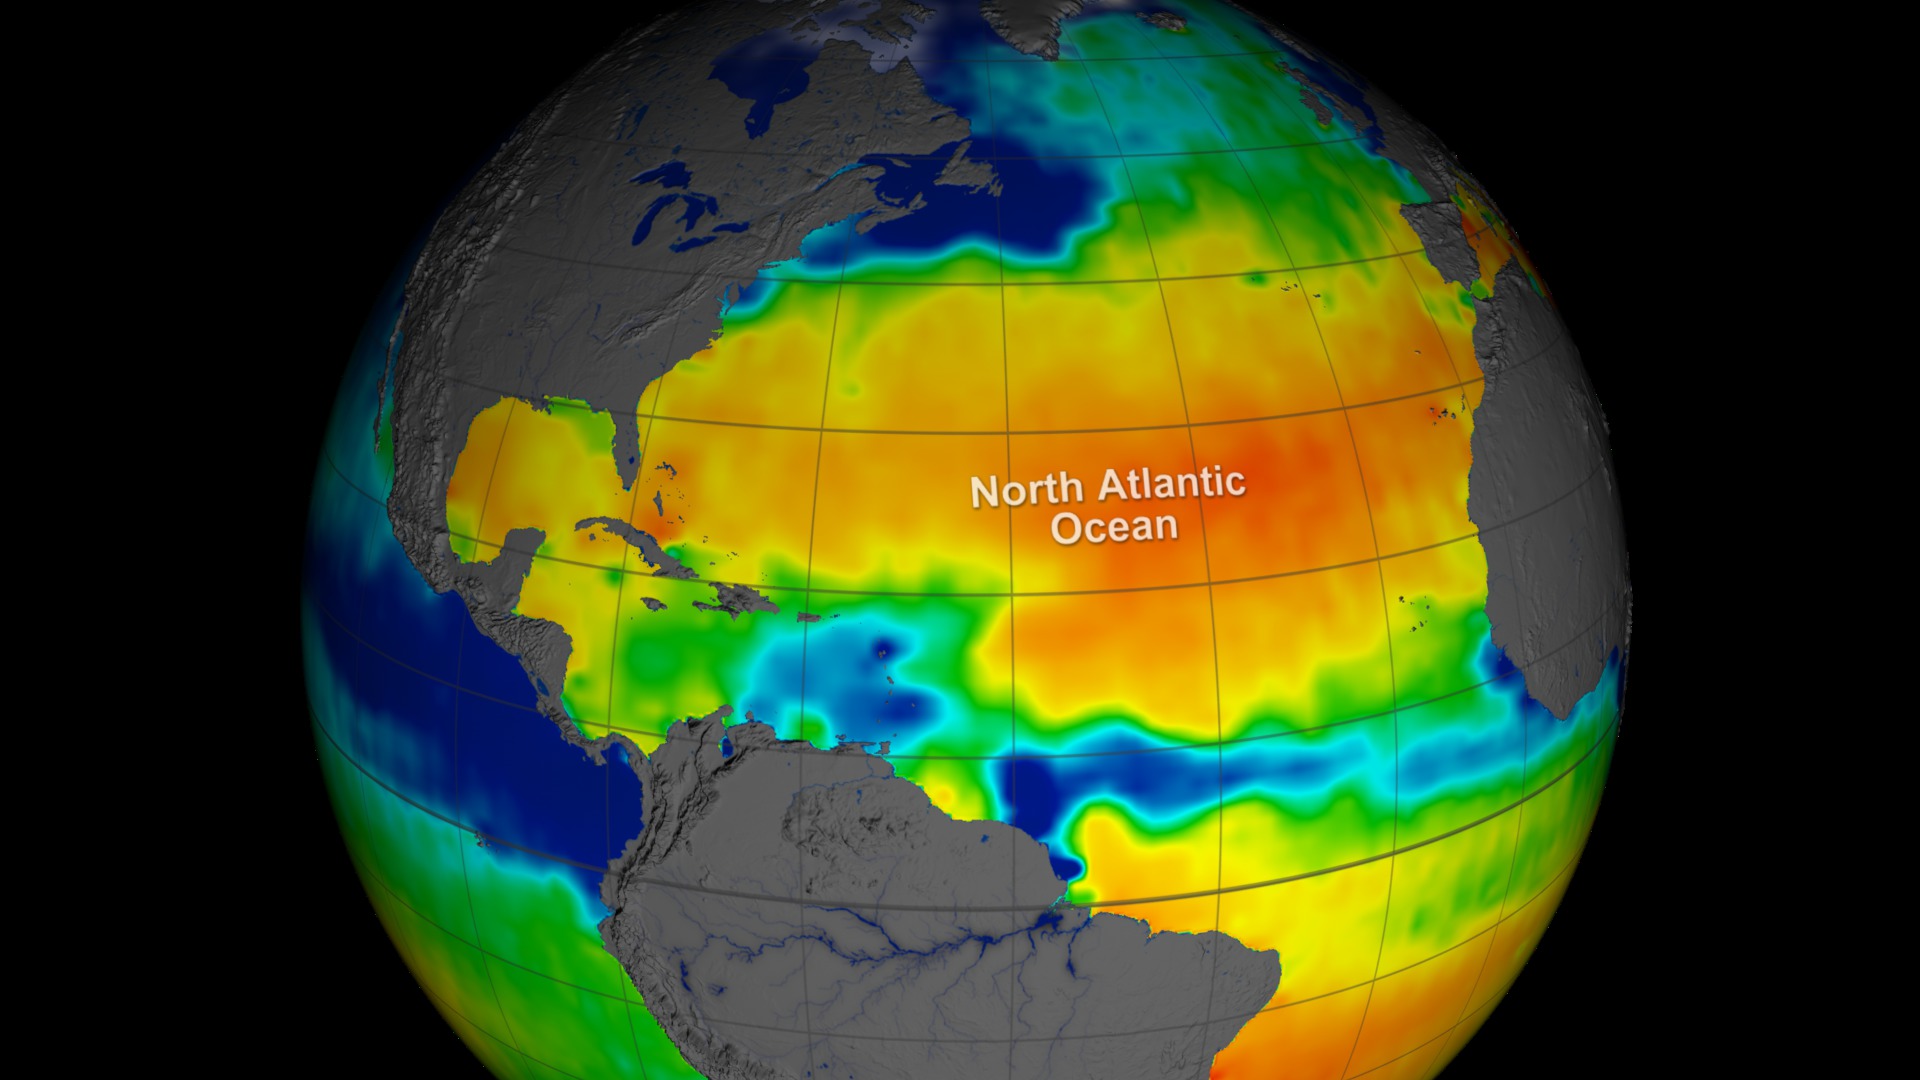
Bright orange colors = very salty. Blue = lower saltiness.
Flying 400 miles above Earth, Aquarius can detect a change as little as a pinch of salt in a gallon of water.
Scientists are studying why some hurricanes that pass over the Amazon River plume of lower saltiness tend to get stronger.
TAG: Aquarius should help with El Niño forecasting as well.
More information: http://aquarius.umaine.edu/cgi/sci_results.htm
Credits
Please give credit for this item to:
NASA's Goddard Space Flight Center
Producer
- Howard Joe Witte (ADNET)
Project support
- Aaron E. Lepsch (ADNET)
Related pages
A Decade of Sea Surface Salinity
Aug. 25th, 2022
Read moreThis data visualization shows sea surface salinity (i.e., ocean salt concentration) over a ten year period (2011 to 2021). Warm colors (orange to yellow) are areas of high salinity/hot tropics. Cooler colors (blue to violet) are fresher waters, many of which can be seen coming from rainy/river/wetter tropics. Sea Surface Salinity (i.e., ocean salt) colorbar. Date overlay for above data visualization. Example composite animation using the colorbar and date overlays. The heat of the sun forces evaporation at the ocean's surface, which puts water vapor into the atmosphere but leaves minerals and salts behind, keeping the ocean salty. The salinity of the ocean also varies from place to place, because evaporation varies based on the sea surface temperature and wind, rivers and rain storms inject fresh water into the ocean, and melting or freezing sea ice affects the salinity of polar waters. Related pages
Aquarius Sea Surface Salinity Tour 2012
Feb. 27th, 2013
Read moreA narrated tour of Aquarius sea surface salinity data highlighting interesting features including: the North Atlantic, Eastern Pacific, Amazon outflow, Labrador current, and Indian Ocean.For complete transcript, click here.This video is also available on our YouTube channel. A Spanish language narrated tour of Aquarius sea surface salinity data highlighting interesting features including: the North Atlantic, Eastern Pacific, Amazon outflow, Labrador current, and Indian Ocean.For complete transcript, click here. A tour of Aquarius sea surface salinity data highlighting interesting features including: the North Atlantic, Eastern Pacific, Amazon outflow, Labrador current, and Indian Ocean. Print resolution still showing the salty North Atlantic. Print resolution still showing the low salinity region in the Eastern Tropical Pacific. Print resolution still showing the massive outflow of fresh water from the Amazon River. Print resolution still showing the low salinity melt water transported near Greenland and Labrador. Print resolution still showing the higher salinity Western Indian Ocean compared to the low salinity Eastern Indian Ocean. Print resolution still showing the Atlantic Ocean. Print resolution still showing the Pacific Ocean. Aquarius color bar intended for the public. The salinity range is low to high, going from blue to green to red. Aquarius color bar intended for scientists. The salinity range is 30 to 40 PSU, going from blue to green to red. The Aquarius spacecraft is designed to measure global sea surface salinity. It is important to understand salinity, the amount of dissolved salts in water, because it will lead us to better understanding of the water cycle and can lead to improved climate models. Aquarius is a collaboration between NASA and the Space Agency of ArgentinaThis visualization celebrates over a year of successful Aquarius observations. Sea surface salinity is shown at various locations around the globe highlighting the following:the Atlantic Ocean is generally much more salty than the Pacificlow salinity waters in the Eastern Equatorial Pacific are transported westwardhigh influxes of fresh water from the Amazon River basin can be clearly seenlow salinity waters are transported by the Labrador current to the southhigh influxes of fresh water from the Ganges River basin can be seen keeping the Eastern Indian Ocean lower salinity than the Western Indian OceanThe range of time shown is December 2011 through Decemeber 2012. The data continuously loops through this range every 6 seconds. This visualization was generated based on version 2.0 of the Aquarius data products with all 3 scanning beams. For More InformationSee [http://www.nasa.gov/mission_pages/aquarius/news/data-first-year.html](http://www.nasa.gov/mission_pages/aquarius/news/data-first-year.html) Related pages
Aquarius Climate
May 9th, 2011
Read moreSea surface salinity has a massive influence on Earth's climate. With Aquarius, scientists will have a new way to measure that influence in a consistent way. With its unprecedented accurate and consistent salinity measurements, Aquarius will help climate modelers to better understand the ocean-atmosphere processes that are changing Earth's climate.For complete transcript, click here. Sea surface salinity has a massive influence on Earth's climate. With Aquarius, scientists will have a new way to measure that influence in a consistent way. With its unprecedented accurate and consistent salinity measurements, Aquarius will help climate modelers to better understand the ocean-atmosphere processes that are changing Earth's climate. Related pages