NASA's IRIS Spots Its Largest Solar Flare
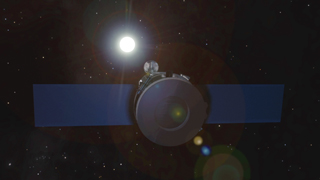
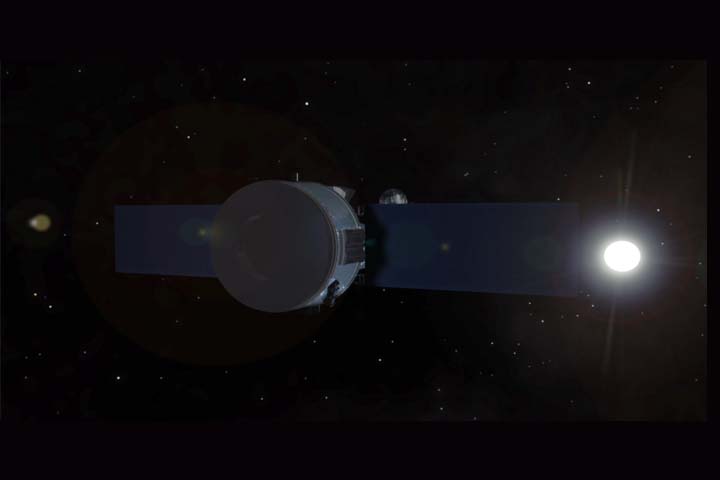
On Jan. 28, 2014, NASA's Interface Region Imaging Spectrograph, or IRIS, witnessed its strongest solar flare since it launched in the summer of 2013. Solar flares are bursts of x-rays and light that stream out into space, but scientists don't yet know the fine details of what sets them off. IRIS peers into a layer of the sun's lower atmosphere just above the surface, called the chromosphere, with unprecedented resolution. However, IRIS can't look at the entire sun at the same time, so the team must always make decisions about what region might provide useful observations. On Jan. 28, scientists spotted a magnetically active region on the sun and focused IRIS on it to see how the solar material behaved under intense magnetic forces. At 2:40 p.m. EST, a moderate flare, labeled an M-class flare — which is the second strongest class flare after X-class – erupted from the area, sending light and x-rays into space. IRIS studies the layer of the sun’s atmosphere called the chromosphere that is key to regulating the flow of energy and material as they travel from the sun's surface out into space. Along the way, the energy heats up the upper atmosphere, the corona, and sometimes powers solar events such as this flare. IRIS is equipped with an instrument called a spectrograph that can separate out the light it sees into its individual wavelengths, which in turn correlates to material at different temperatures, velocities and densities. The spectrograph on IRIS was pointed right into the heart of this flare when it reached its peak, and so the data obtained can help determine how different temperatures of plasma flow where, giving scientists more insight into how flares work.
On Jan. 28, 2014, NASA's newly-launched Interface Region Imaging Spectrograph, or IRIS, observed its strongest solar flare to date.
Credit: NASA/IRIS/SDO/Goddard Space Flight Center
Watch this video on the NASA Goddard's YouTube channel.
For complete transcript, click here.

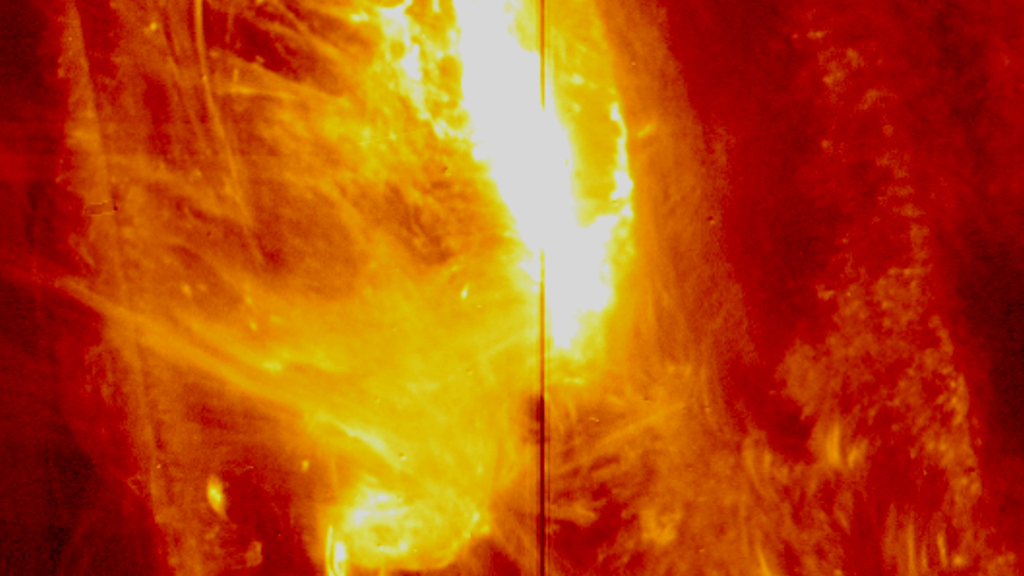
Still image from Jan. 28, 2014 flare as seen NASA's newly-launched Interface Region Imaging Spectrograph, or IRIS.
Credit: NASA/IRIS/SDO/Goddard Space Flight Center
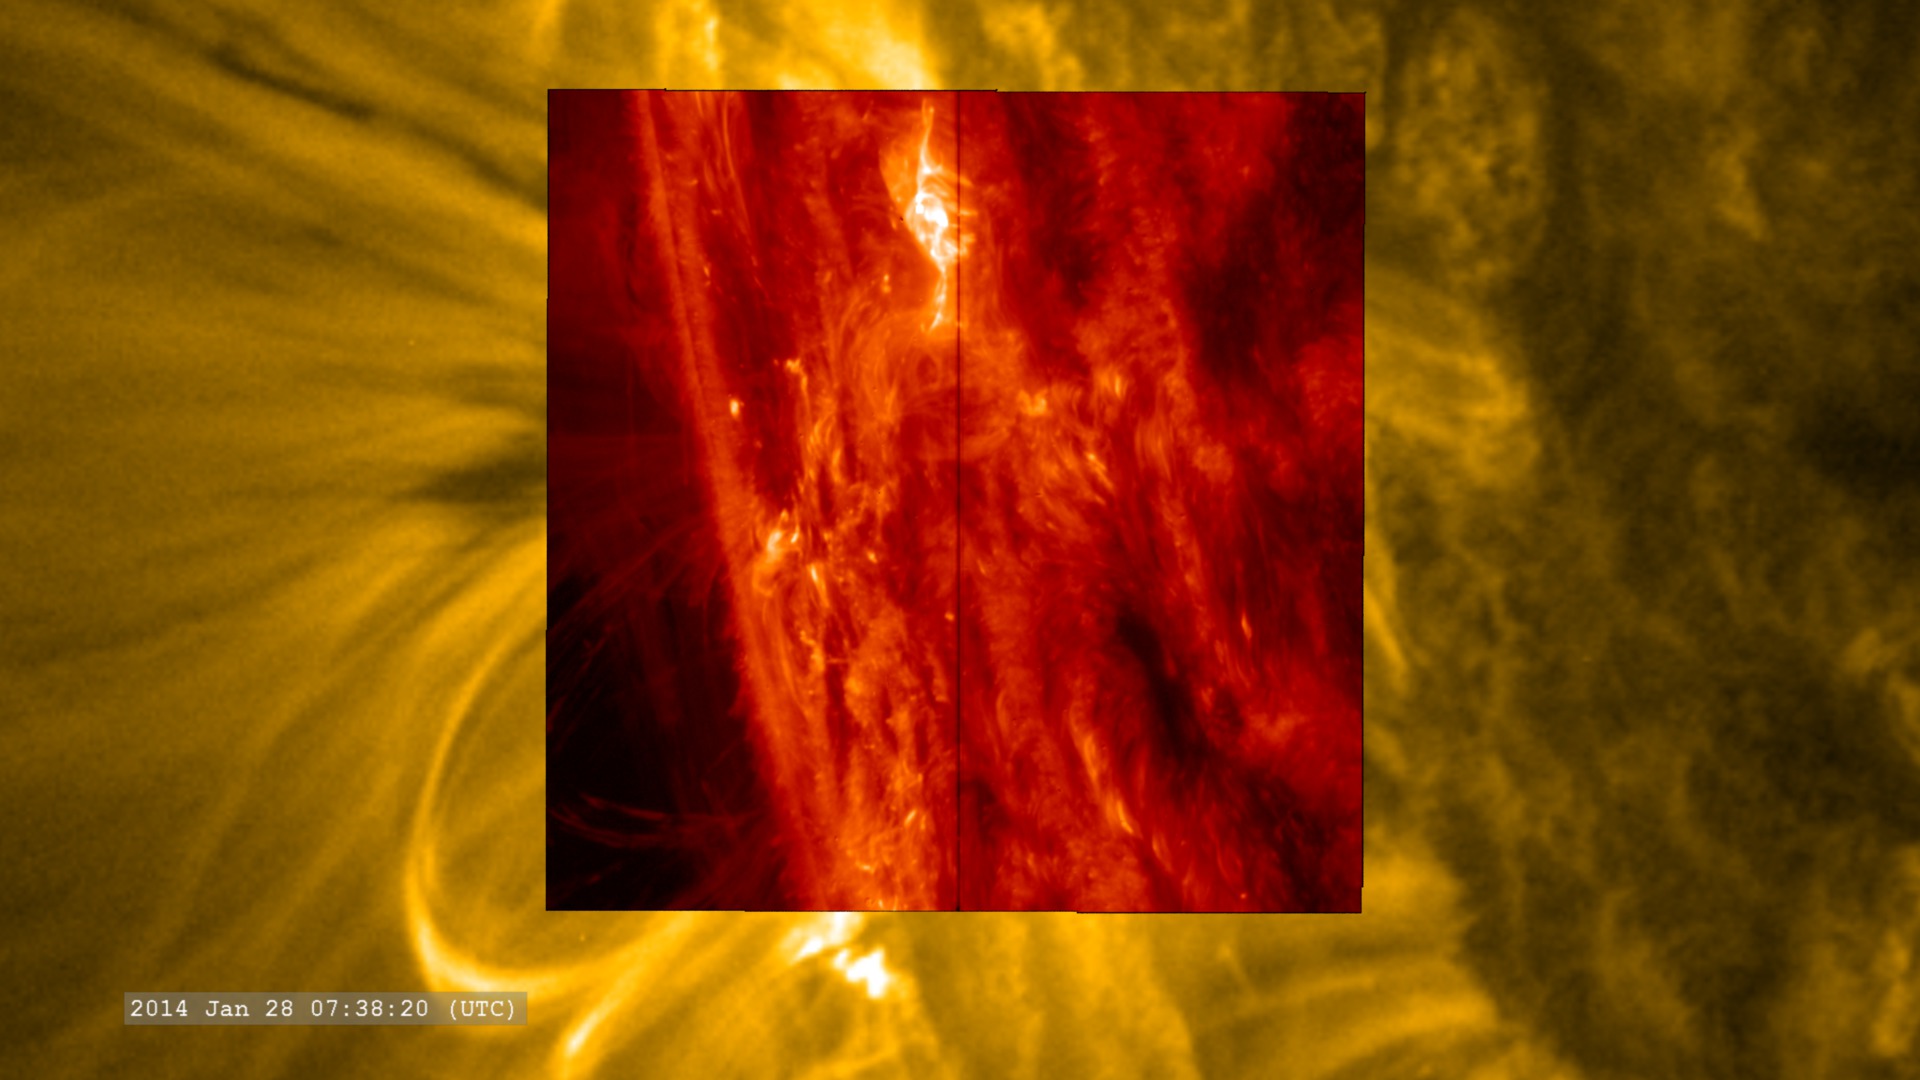
Image comparing a how NASA's Solar Dynamics Observatory (SDO), and the Region Imaging Spectrograph (IRIS), observed a solar flare on January 28, 2014.
Credit: NASA/IRIS/SDO/Goddard Space Flight Center
Credits
Please give credit for this item to:
NASA's Goddard Space Flight Center
-
Animator
- Tom Bridgman (Global Science and Technology, Inc.)
-
Narrator
- Karen Fox (ADNET Systems, Inc.)
-
Producer
- Genna Duberstein (USRA)
-
Scientists
- Adrian Daw (NASA/GSFC)
- Bart De Pontieu (Lockheed Martin Solar and Astrophysics Lab)
-
Project support
- Aaron E. Lepsch (ADNET Systems, Inc.)
-
Writer
- Karen Fox (ADNET Systems, Inc.)
Release date
This page was originally published on Friday, February 21, 2014.
This page was last updated on Wednesday, May 3, 2023 at 1:51 PM EDT.
Missions
This visualization is related to the following missions:Series
This visualization can be found in the following series:Tapes
This visualization originally appeared on the following tapes:-
IRIS Captures a Solar Flare
(ID: 2014019)
Monday, February 24, 2014 at 5:00AM
Produced by - Will Duquette (NASA)
Related
- ID: 11897
 Produced Video
 - ID: 11467
 Produced Video
 - ID: 4146
 Visualization
 - ID: 11256