SDO: Year 3
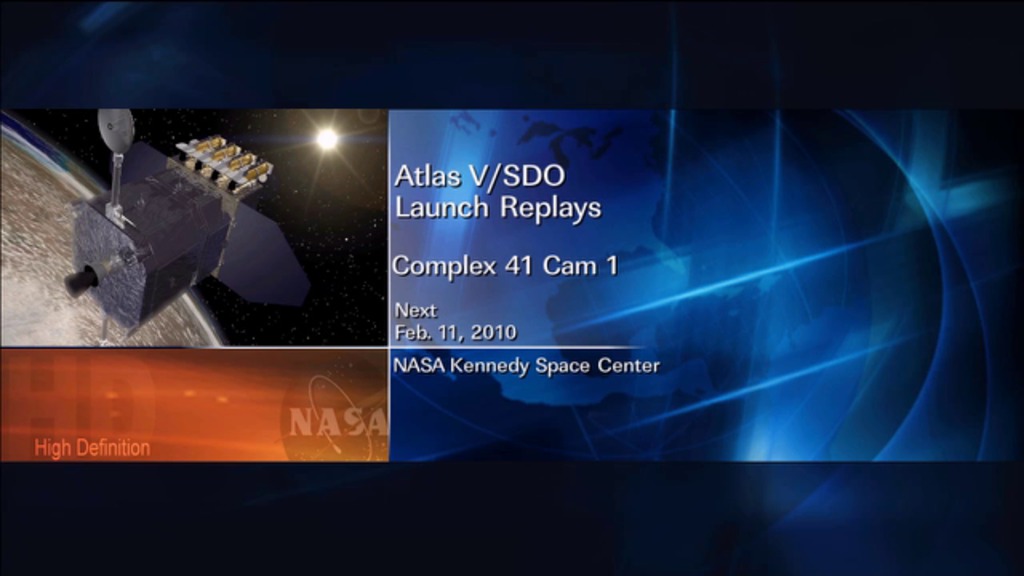
On Feb. 11, 2010, NASA launched an unprecedented solar observatory into space. The Solar Dynamics Observatory (SDO) flew up on an Atlas V rocket, carrying instruments that scientists hoped would revolutionize observations of the sun. If all went according to plan, SDO would provide incredibly high-resolution data of the entire solar disk almost as quickly as once a second.
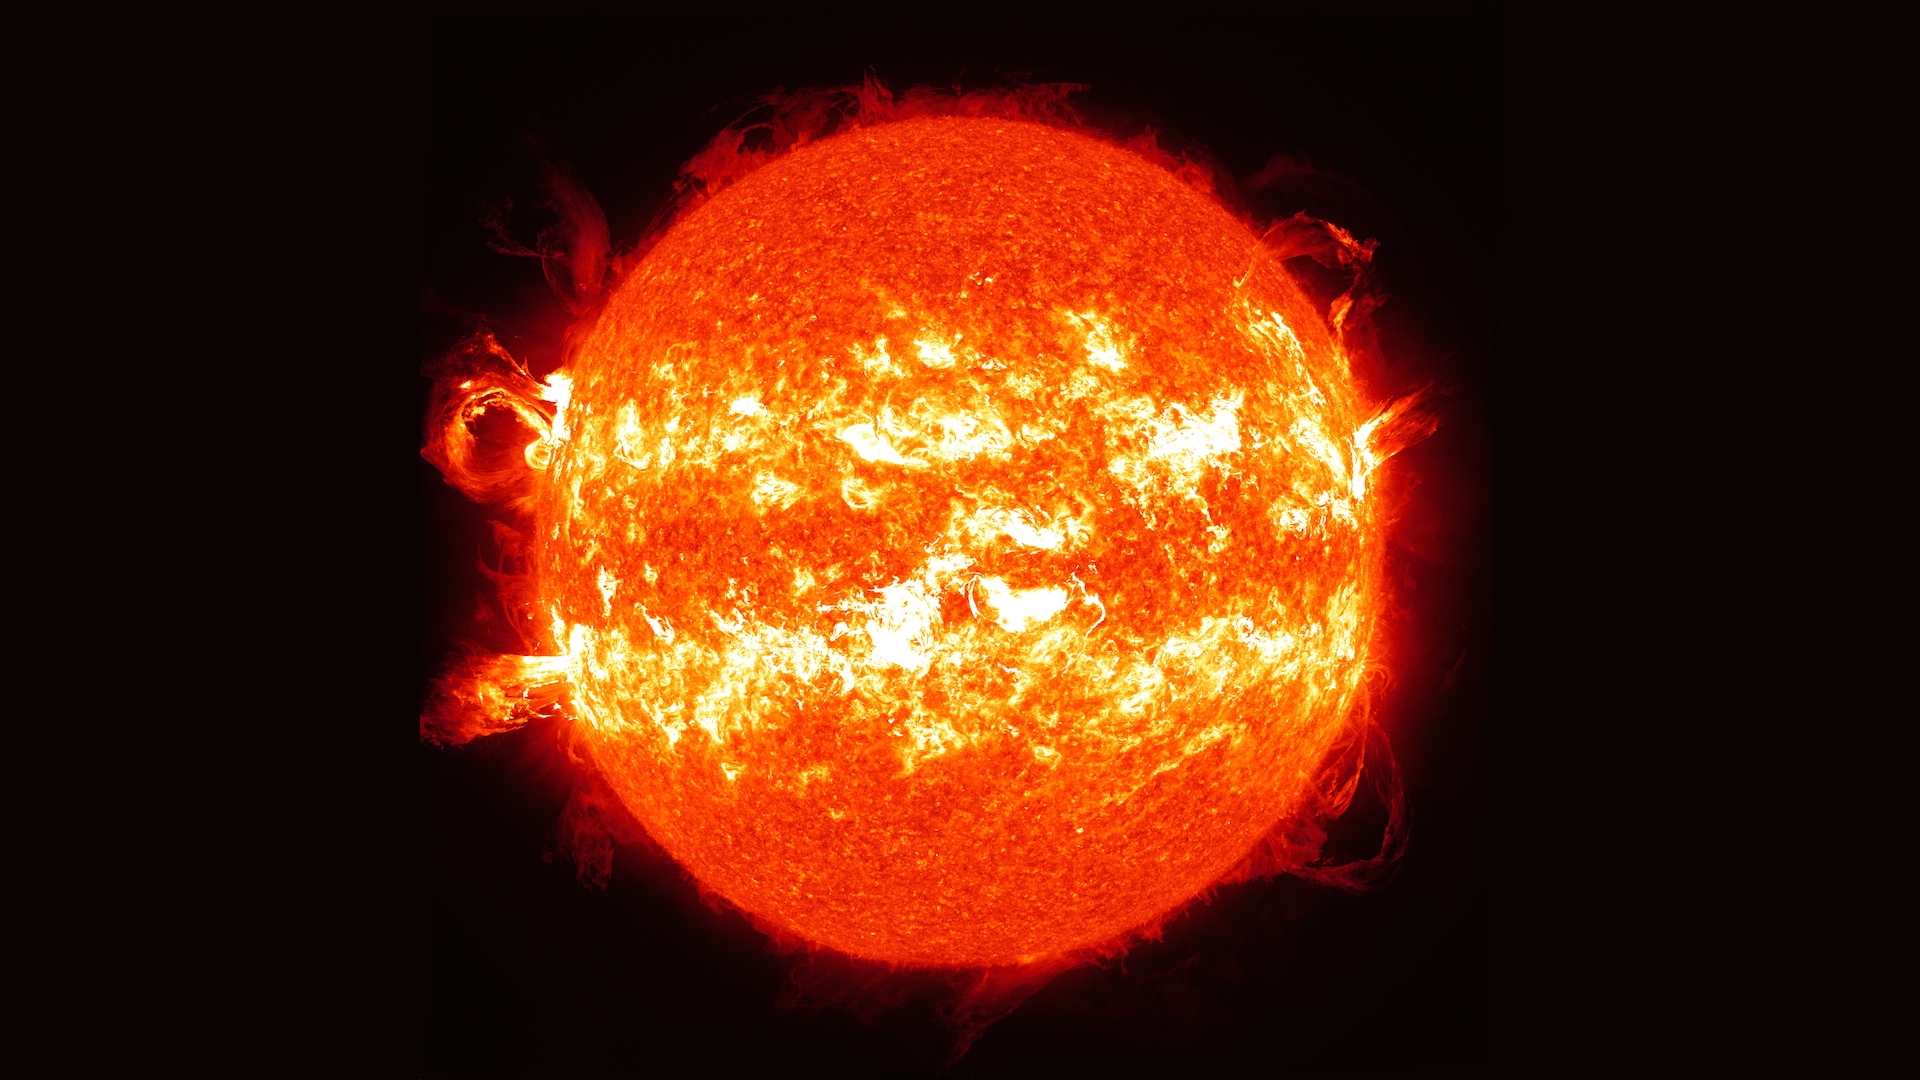
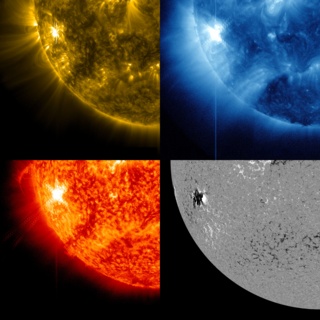
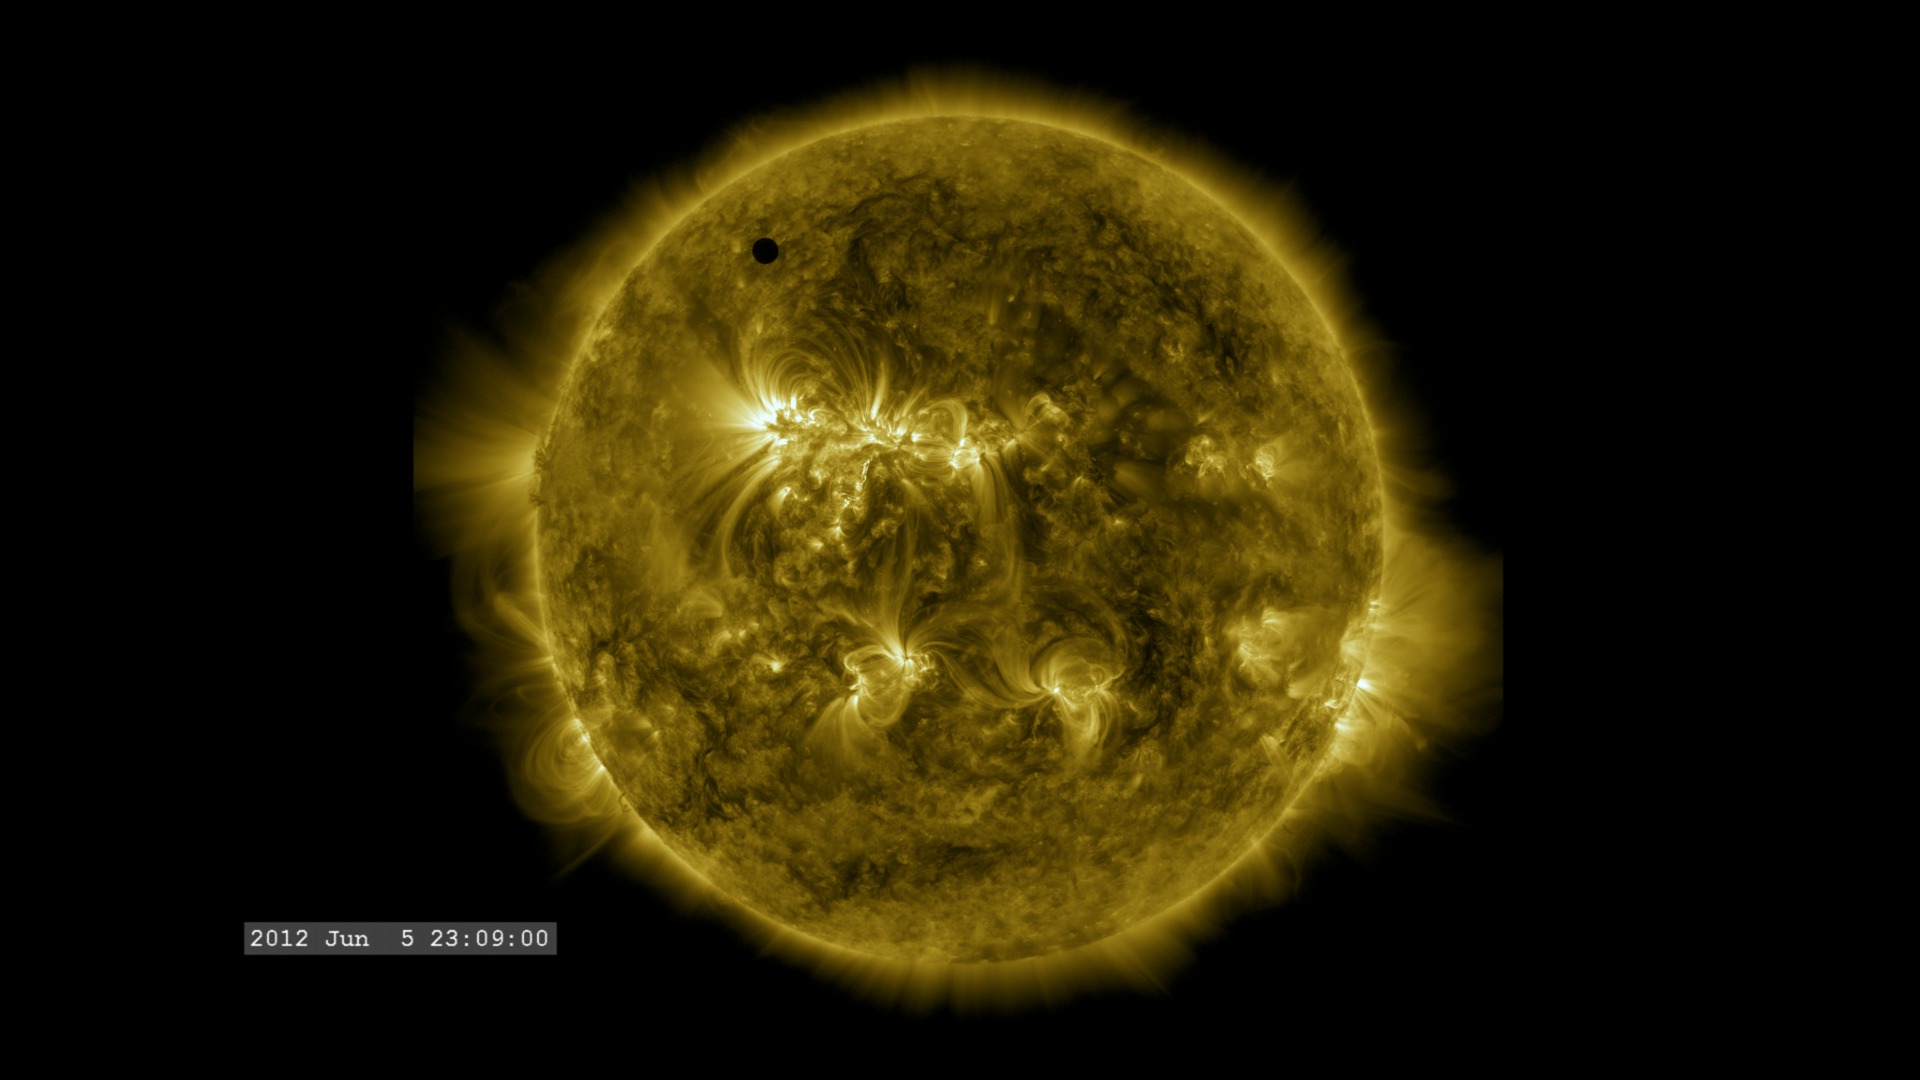
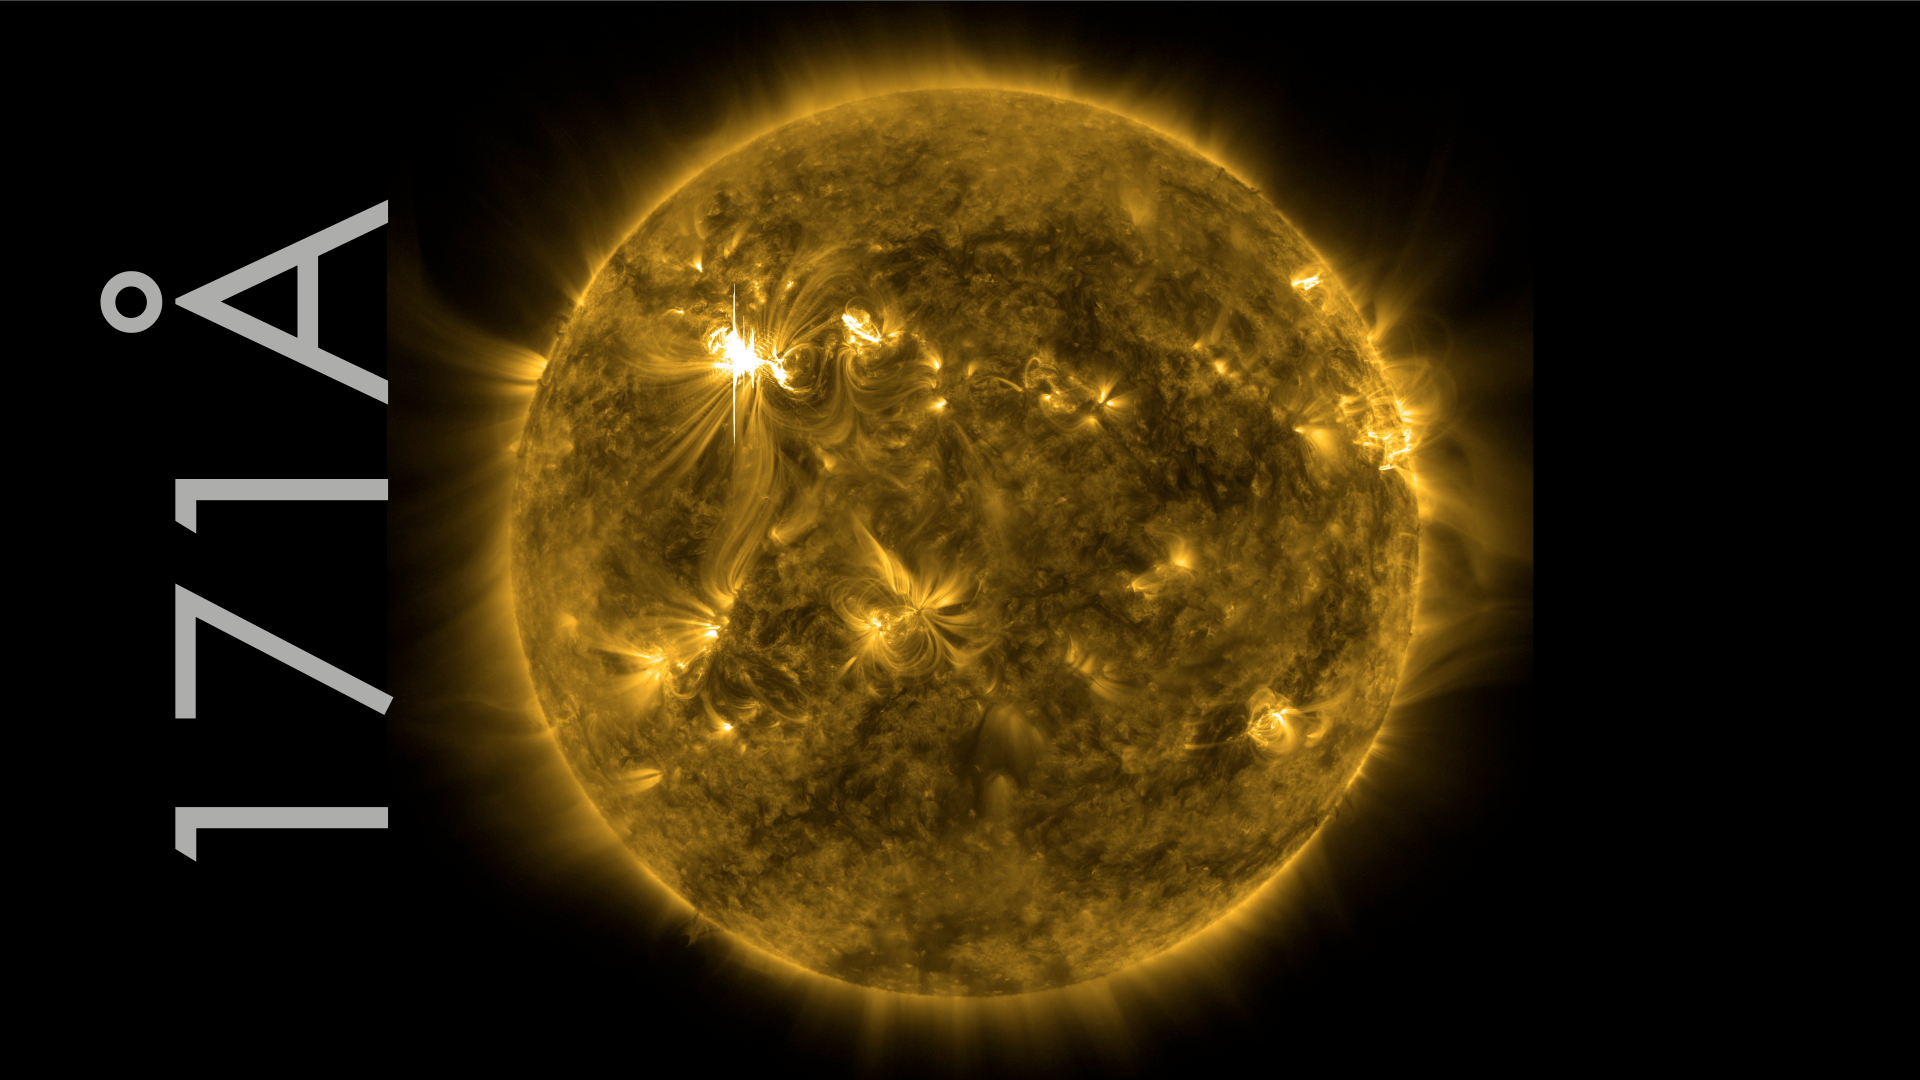
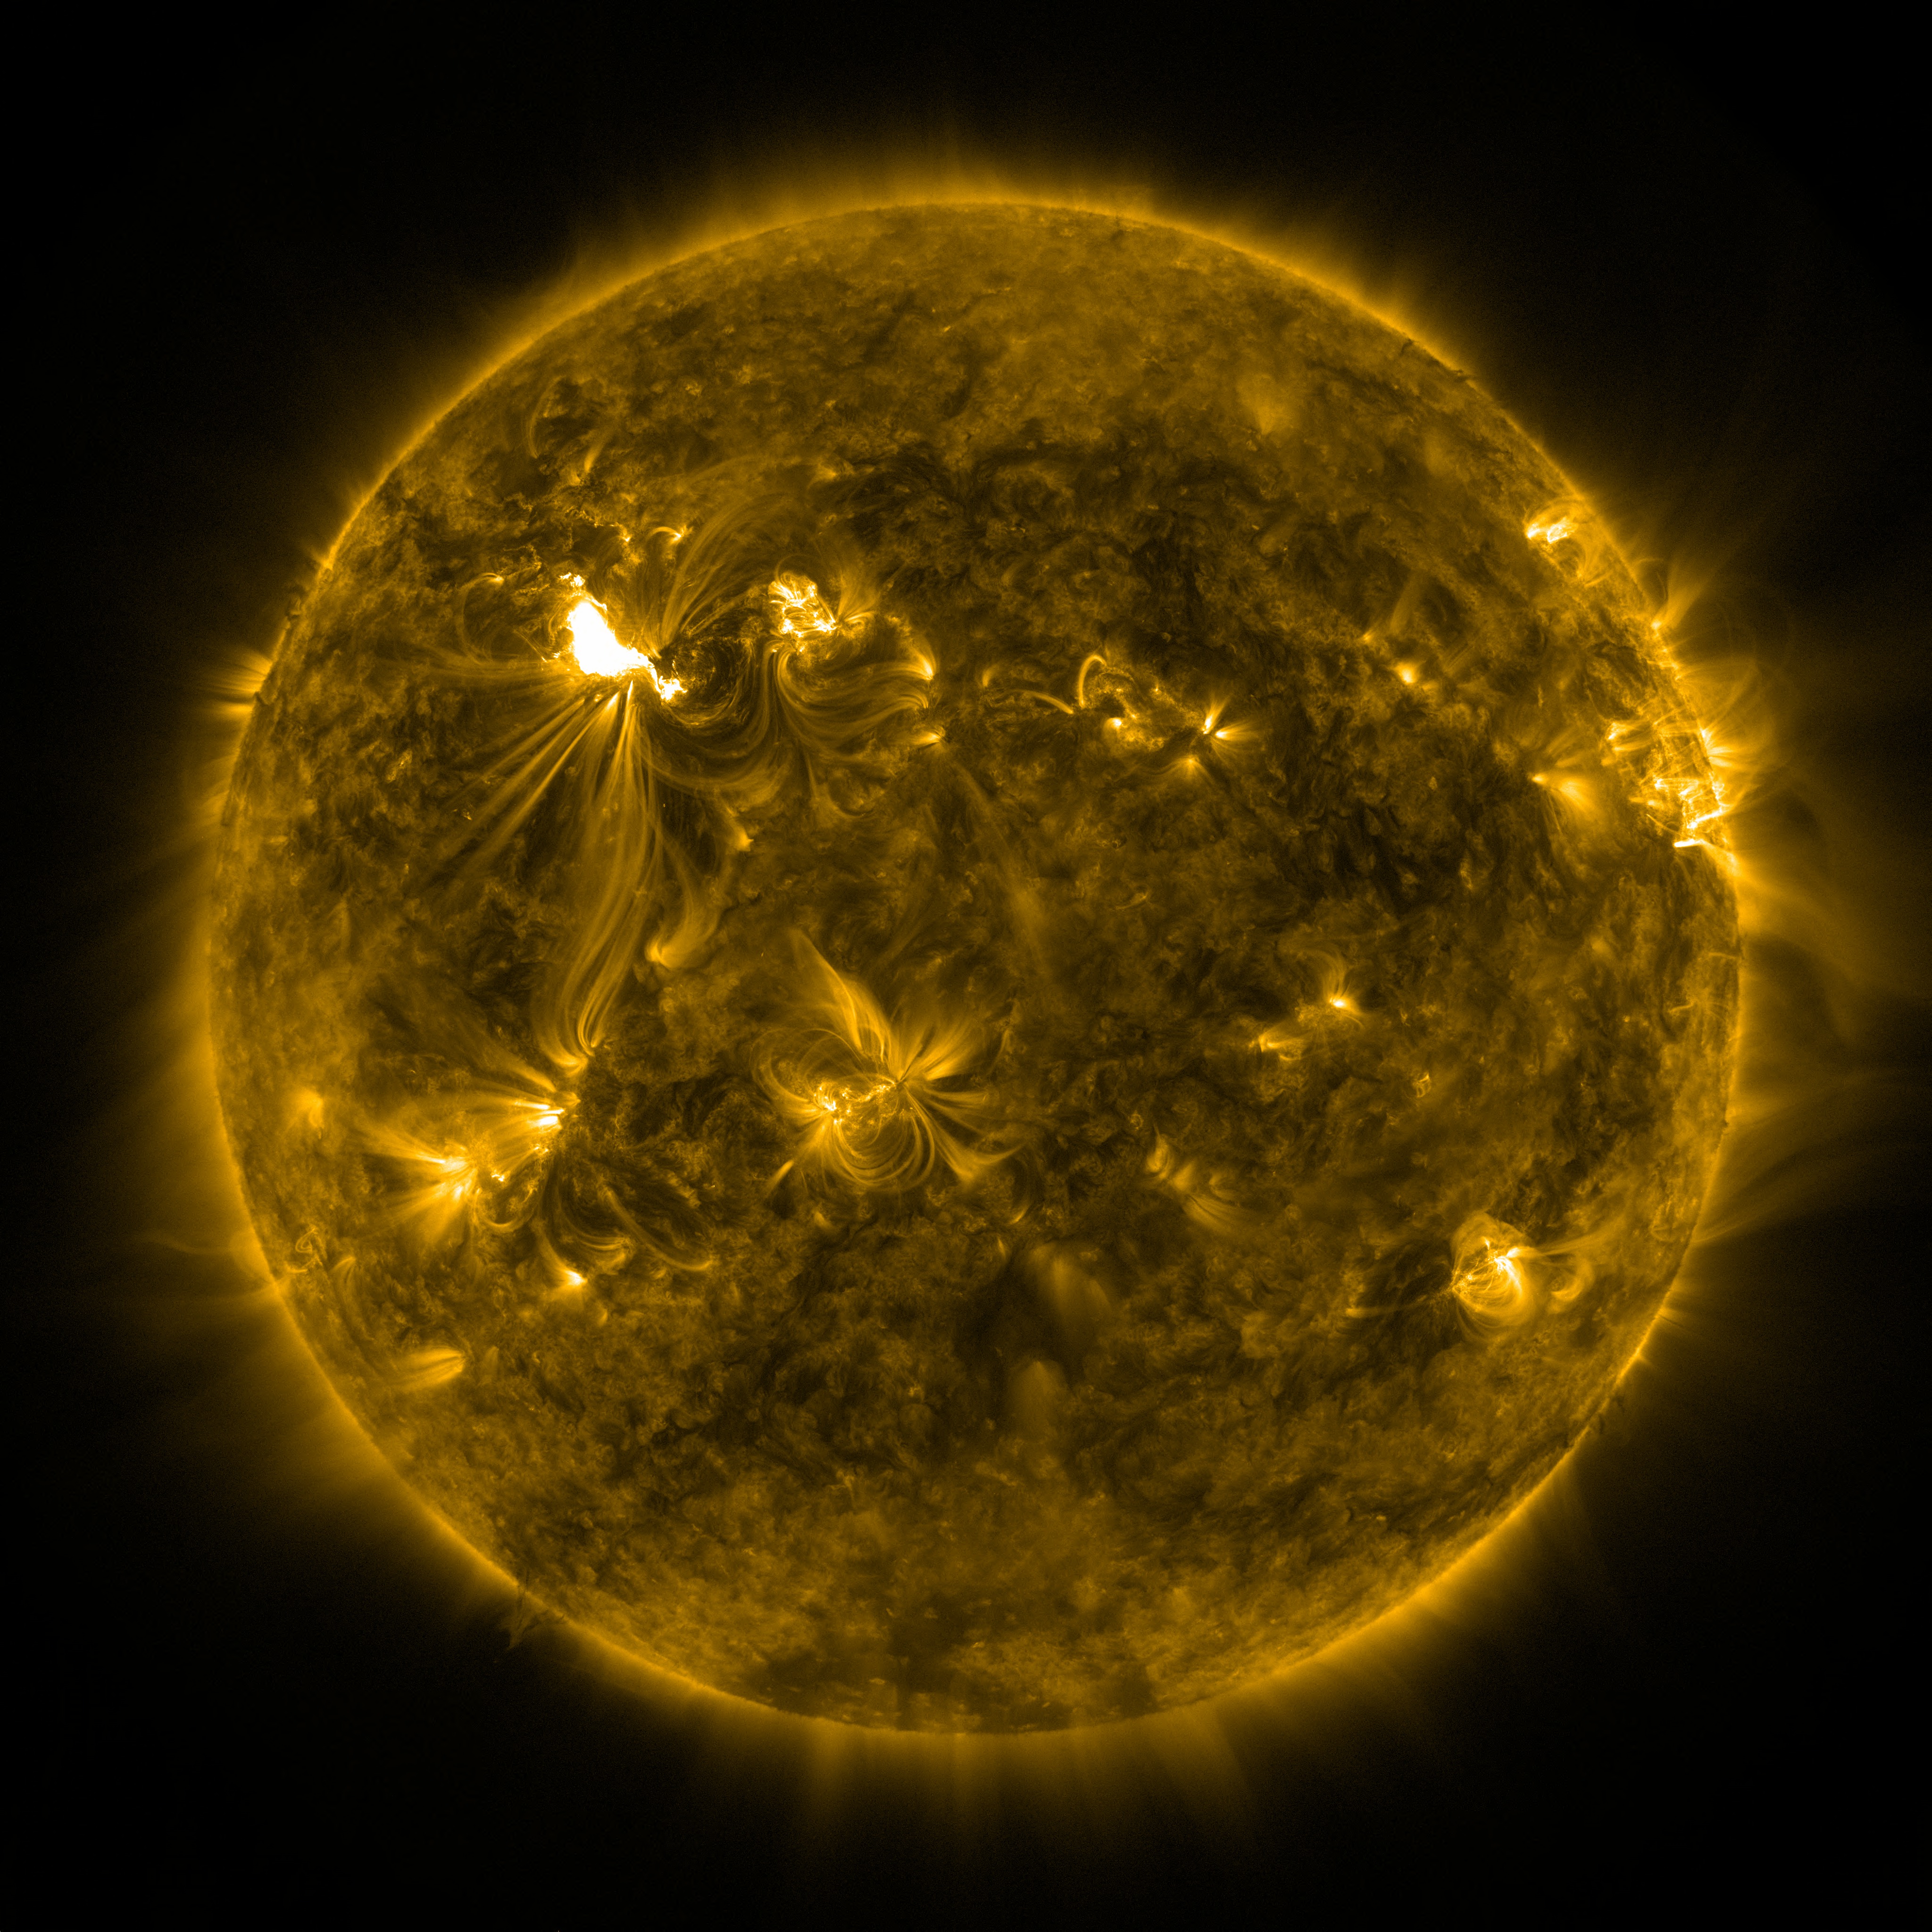
When the science team released its first images in April of 2010, SDO's data exceeded everyone's hopes and expectations, providing stunningly detailed views of the sun. In the three years since then, SDO's images have continued to show breathtaking pictures and movies of eruptive events on the sun. Such imagery is more than just pretty, they are the very data that scientists study. By highlighting different wavelengths of light, scientists can track how material on the sun moves. Such movement, in turn, holds clues as to what causes these giant explosions, which, when Earth-directed, can disrupt technology in space.
SDO is the first mission in a NASA's Living With a Star program, the goal of which is to develop the scientific understanding necessary to address those aspects of the sun-Earth system that directly affect our lives and society. NASA's Goddard Space Flight Center in Greenbelt, Md. built, operates, and manages the SDO spacecraft for NASA's Science Mission Directorate in Washington, D.C.
SDO: Year One here.
SDO: Year 2 here.
Information about the individual clips used in this video is here.
Watch this video on YouTube.
The sun's greatest hits as captured by the Solar Dynamic Observatory from February 2012 to February 2013.
Music: Mistake (Davide Rossi Re-Work - Instrumental) courtesy of Moby Gratis.
For complete transcript, click here.

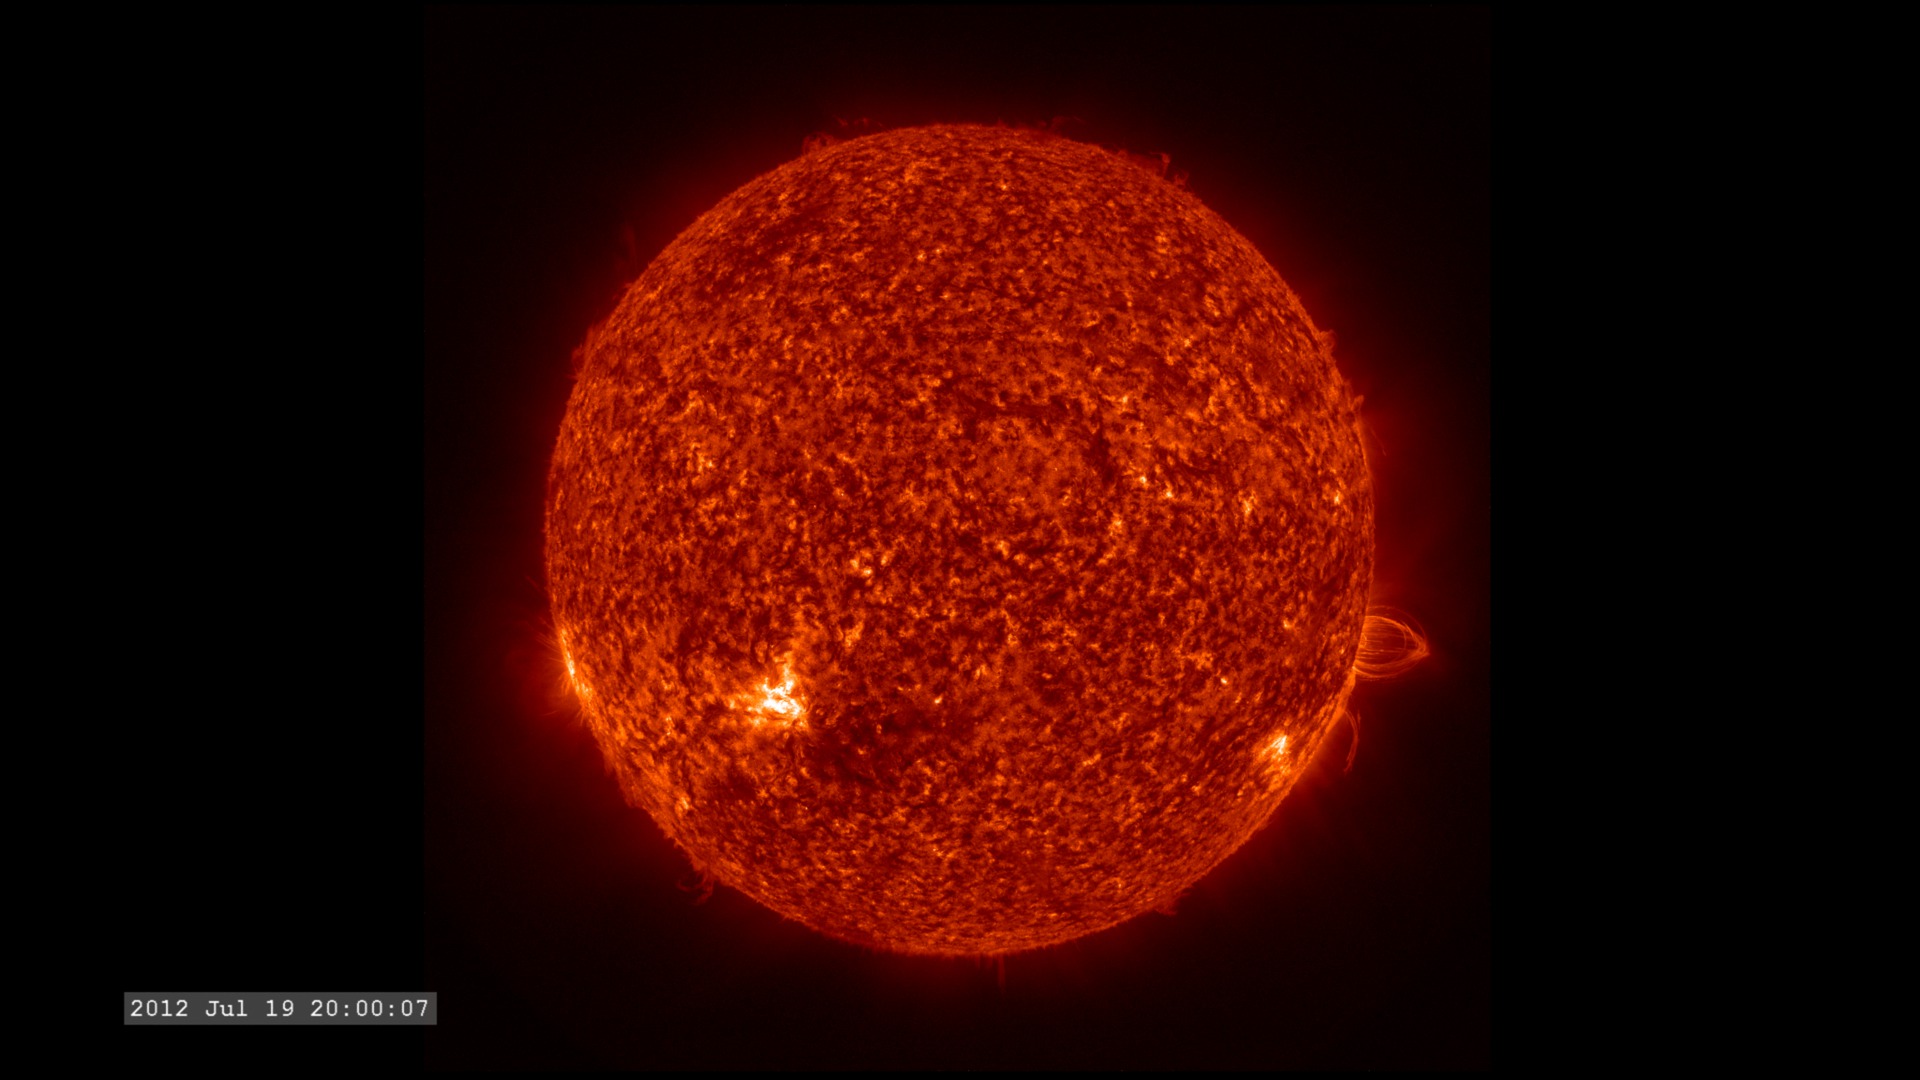
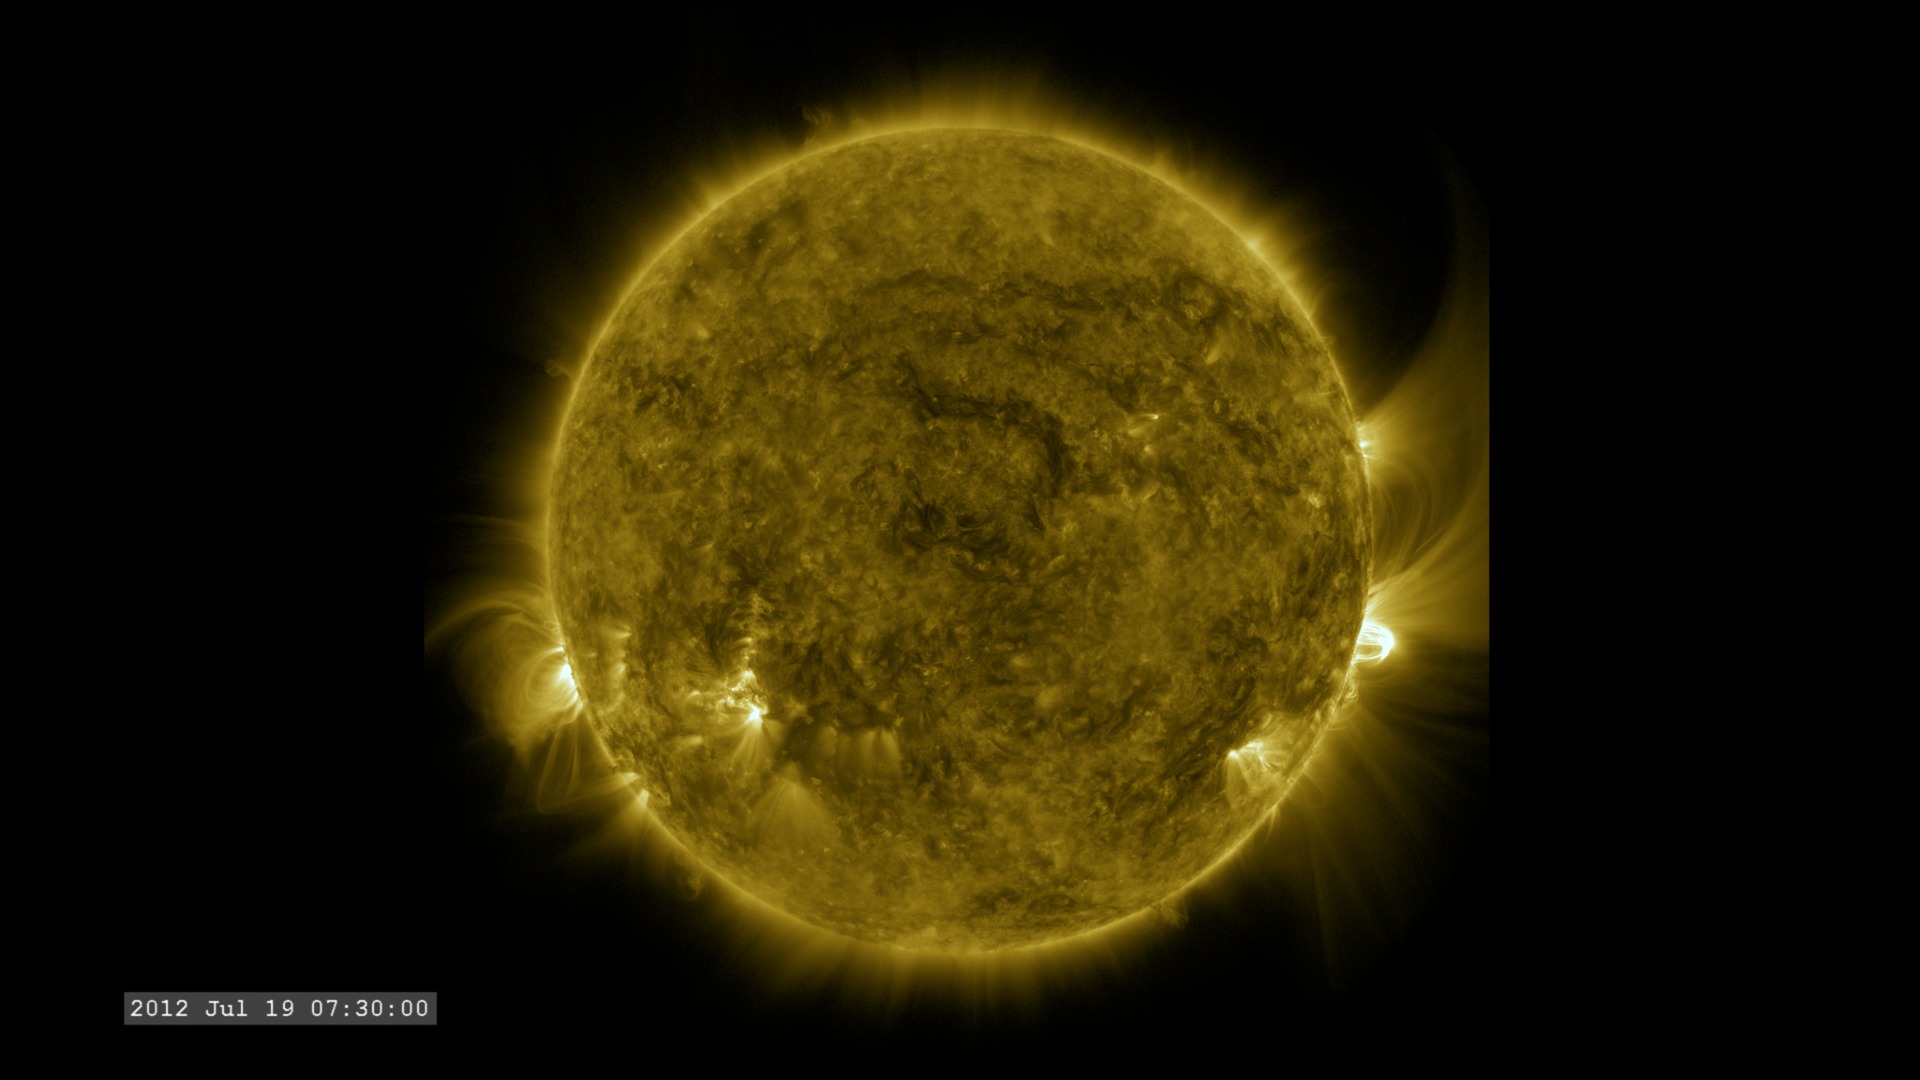
Blended 131 angstrom and 171 angstrom images of July 19, 2012 flare and CME.
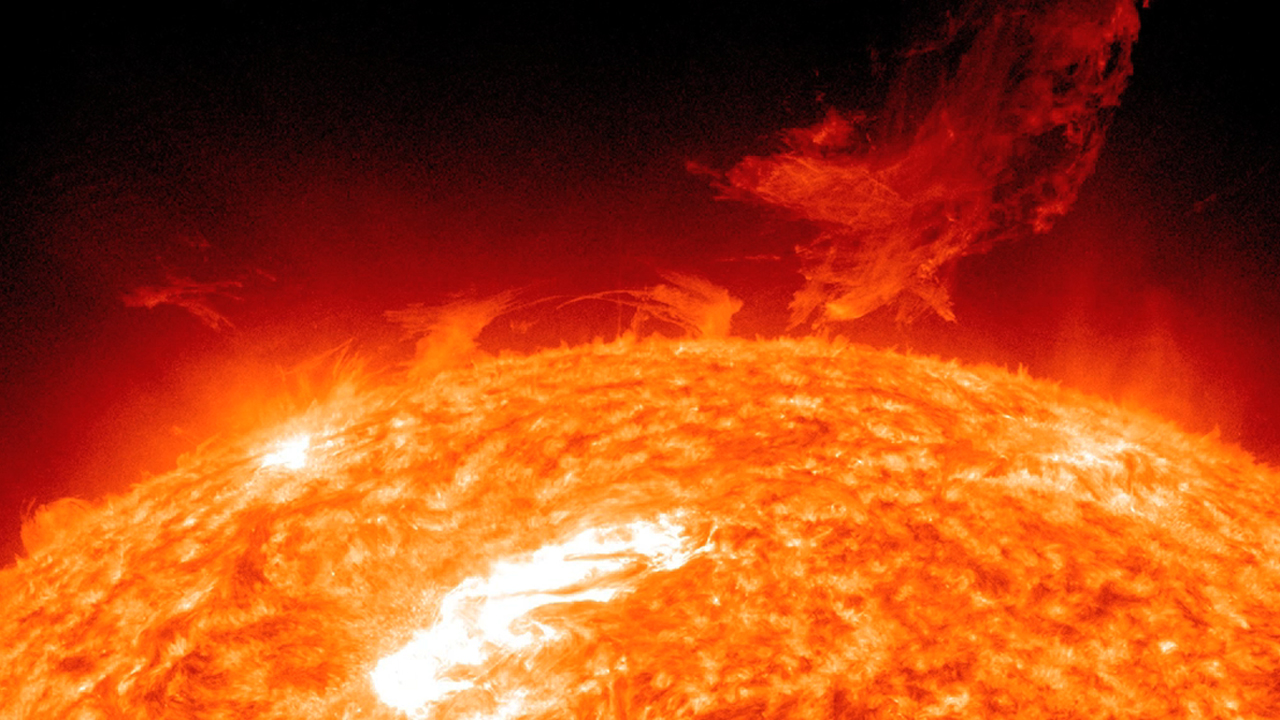
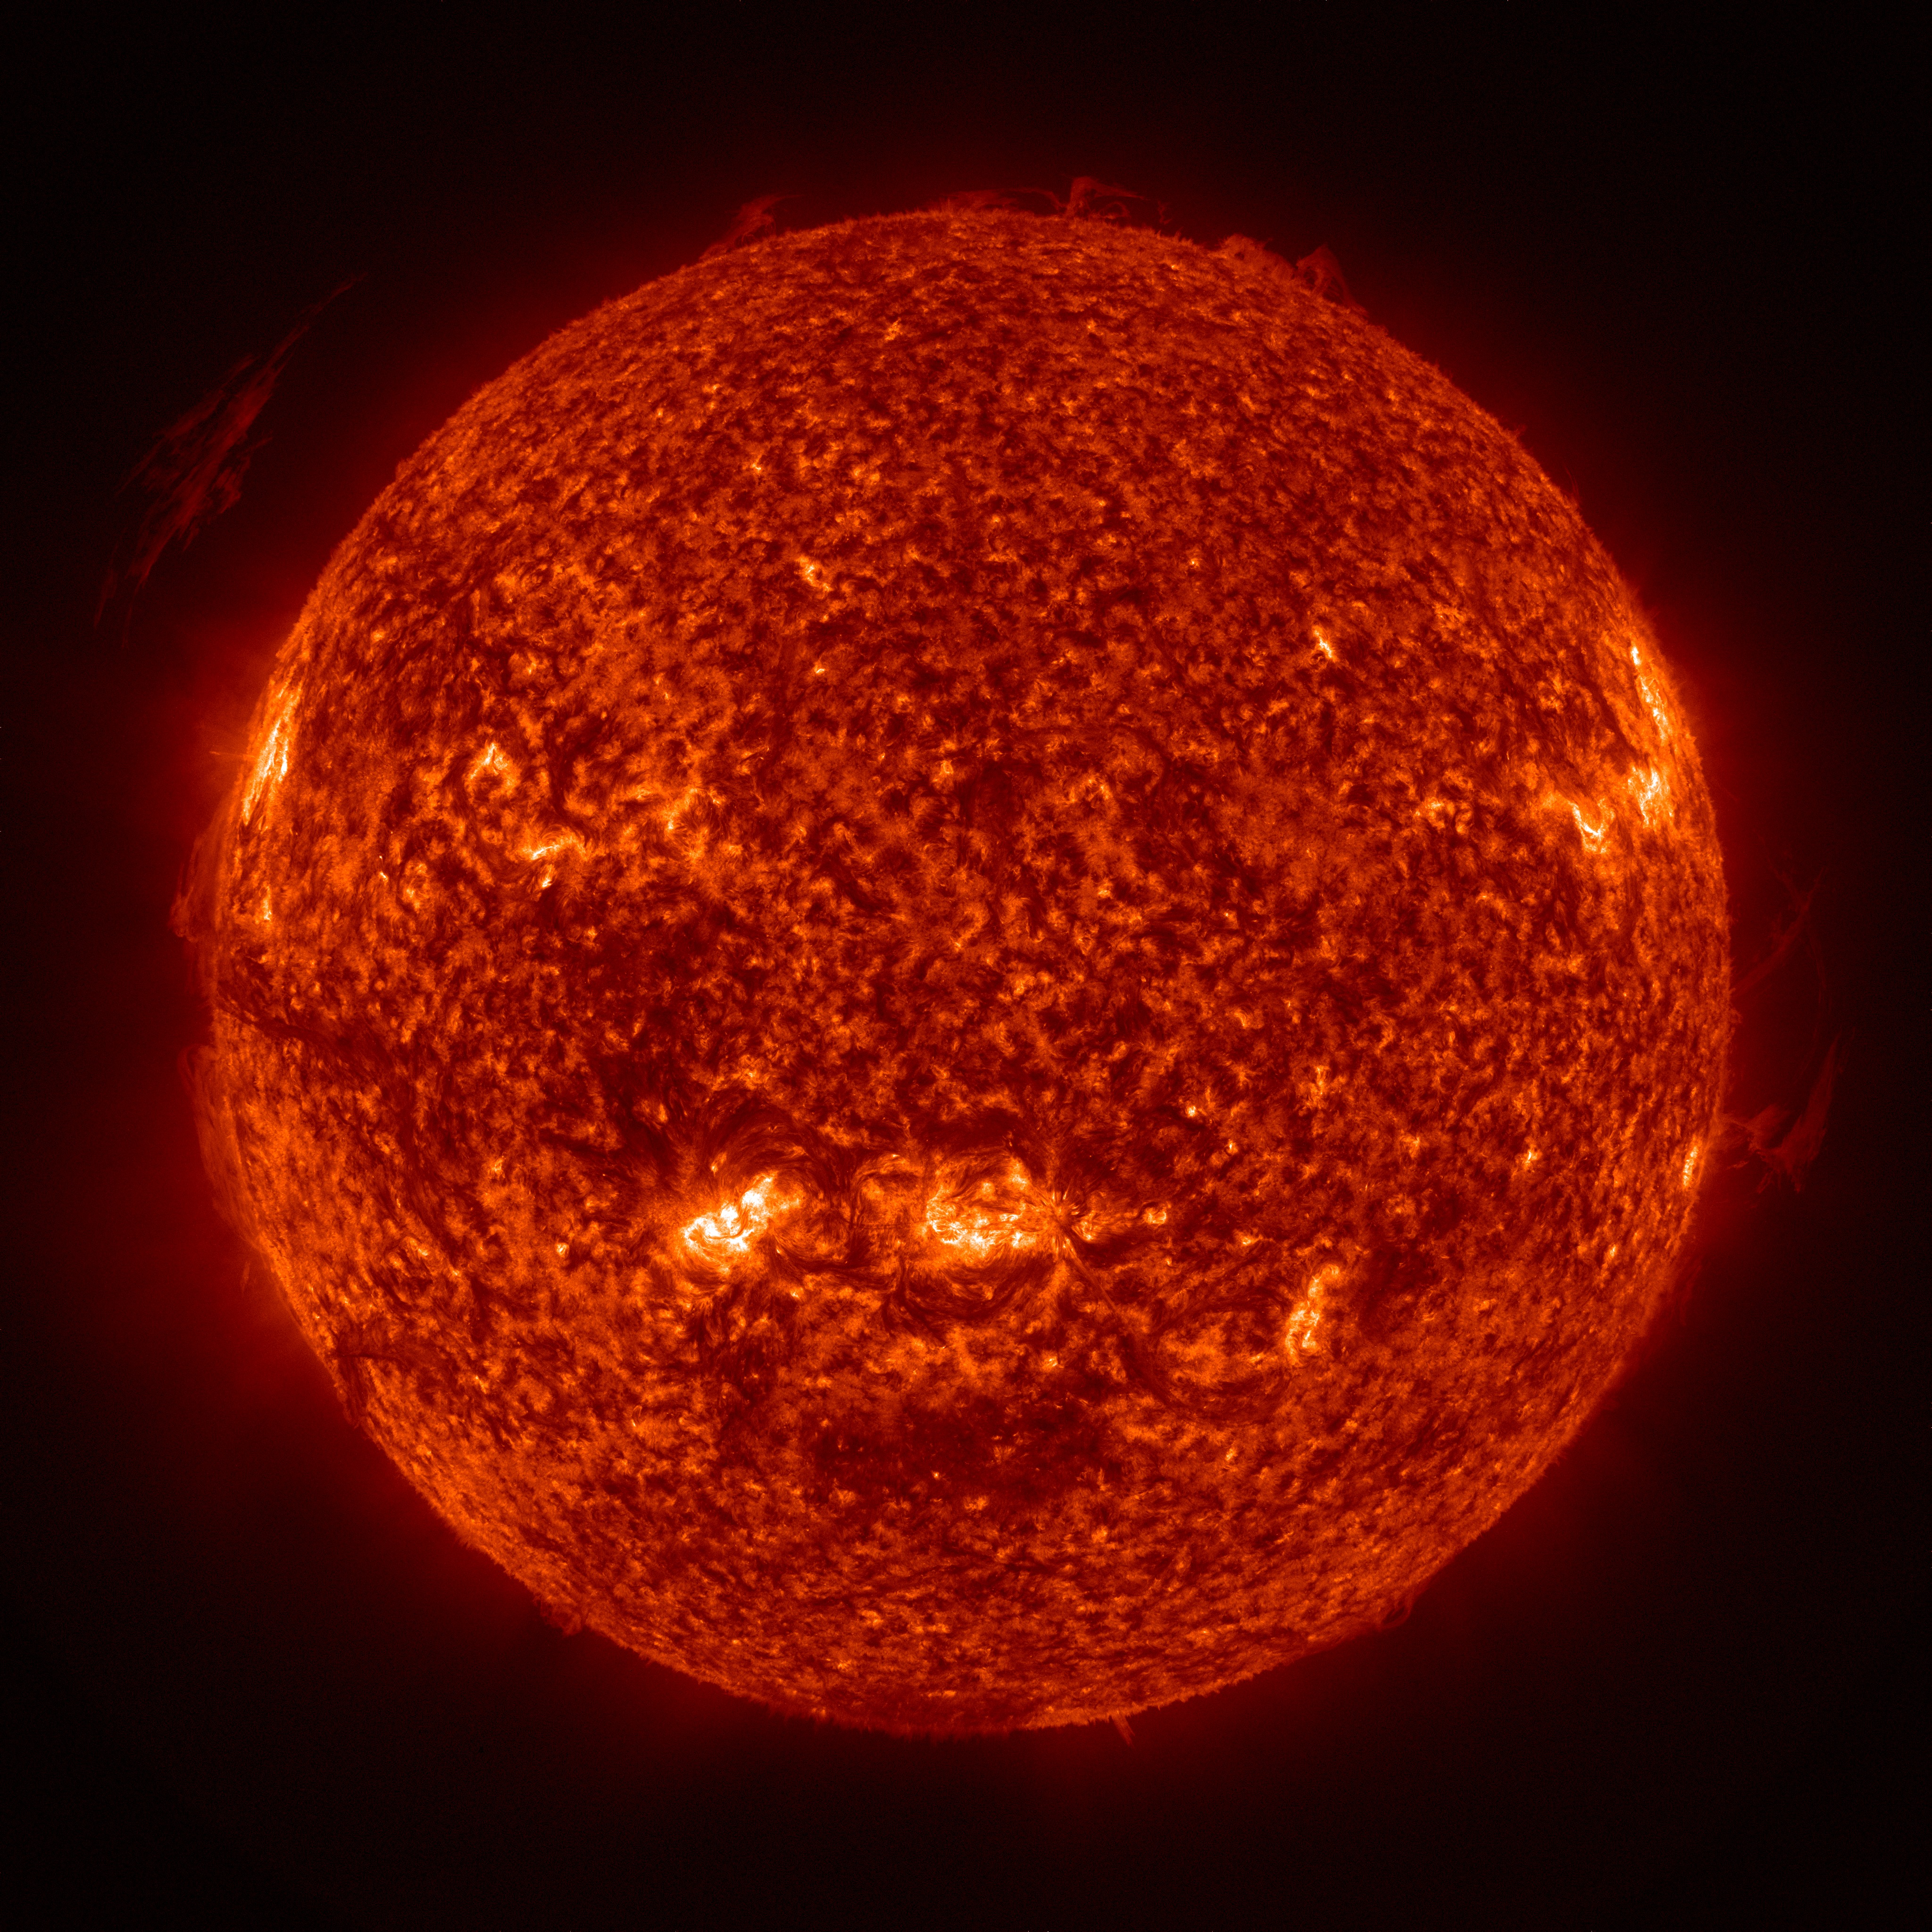
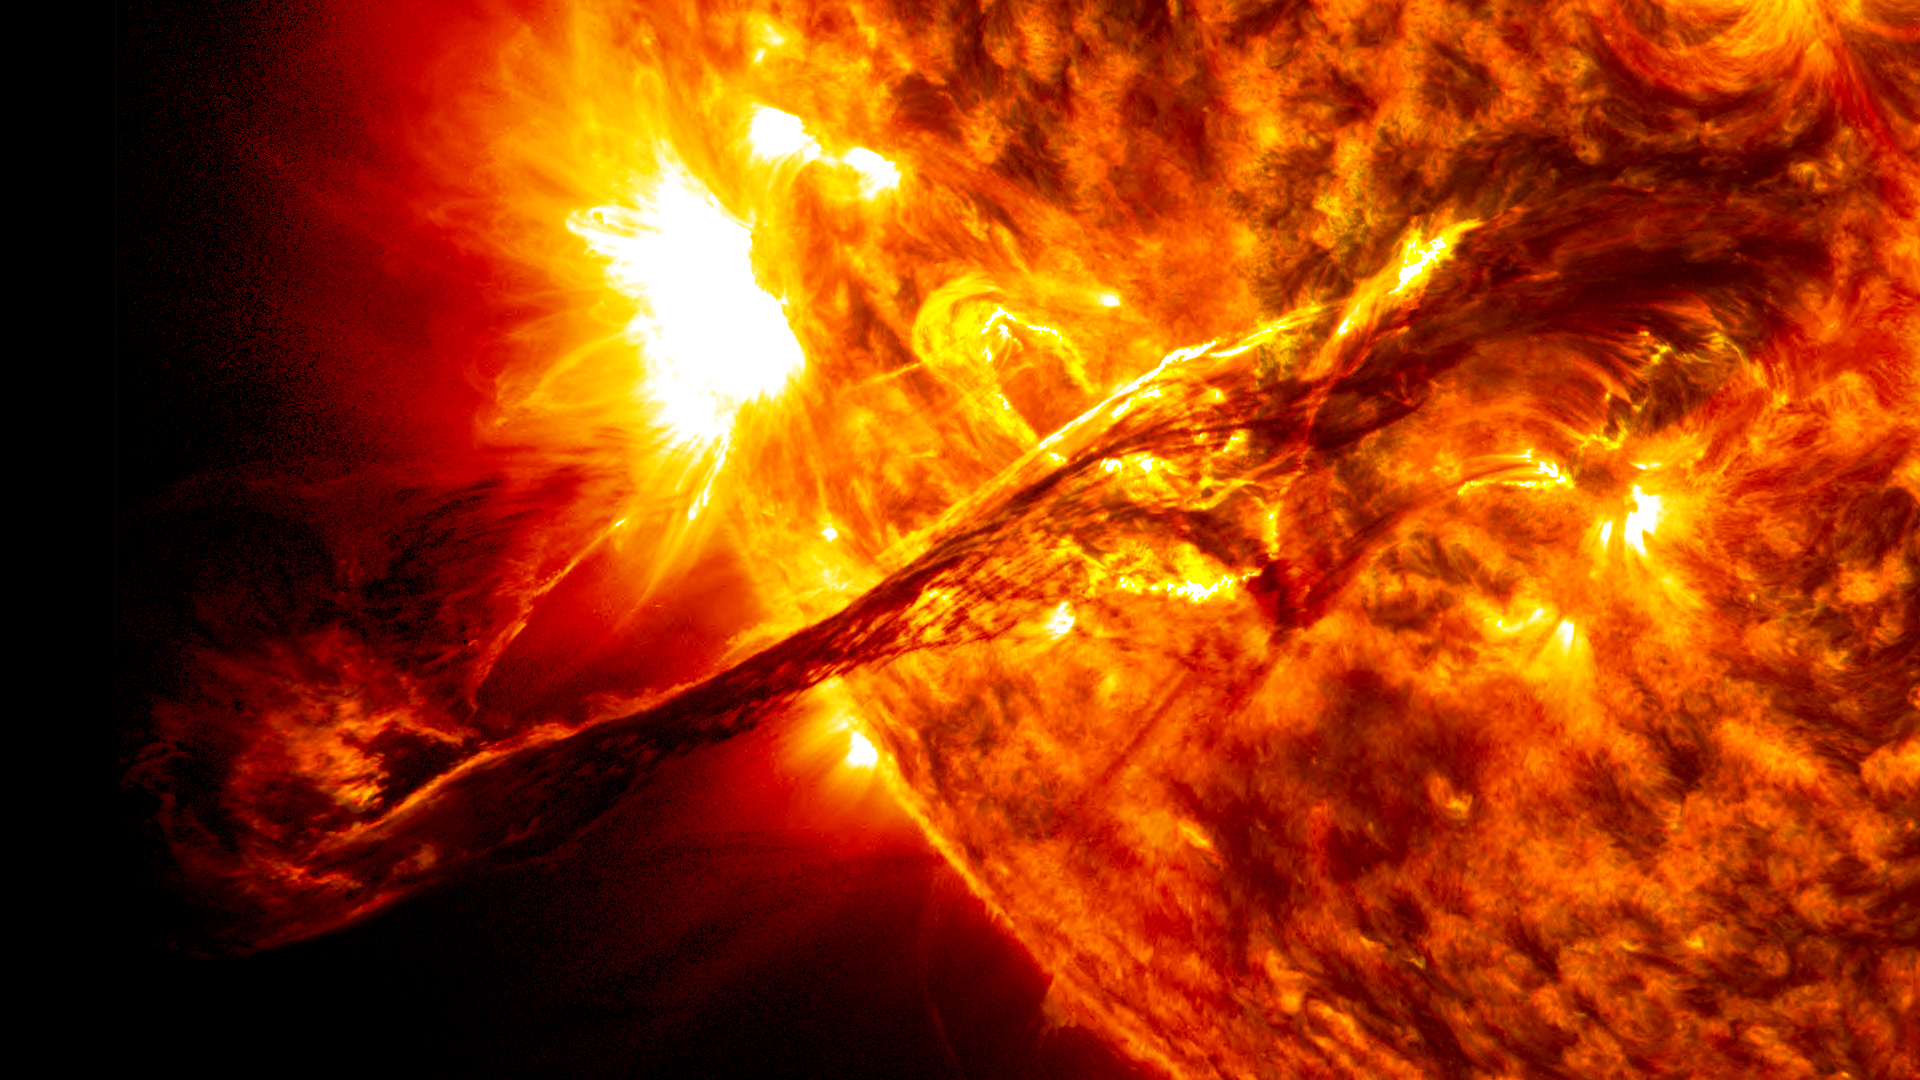
Blended images in 304 and 171 angstrom wavelength light of August 31, 2012 prominence eruption and CME.
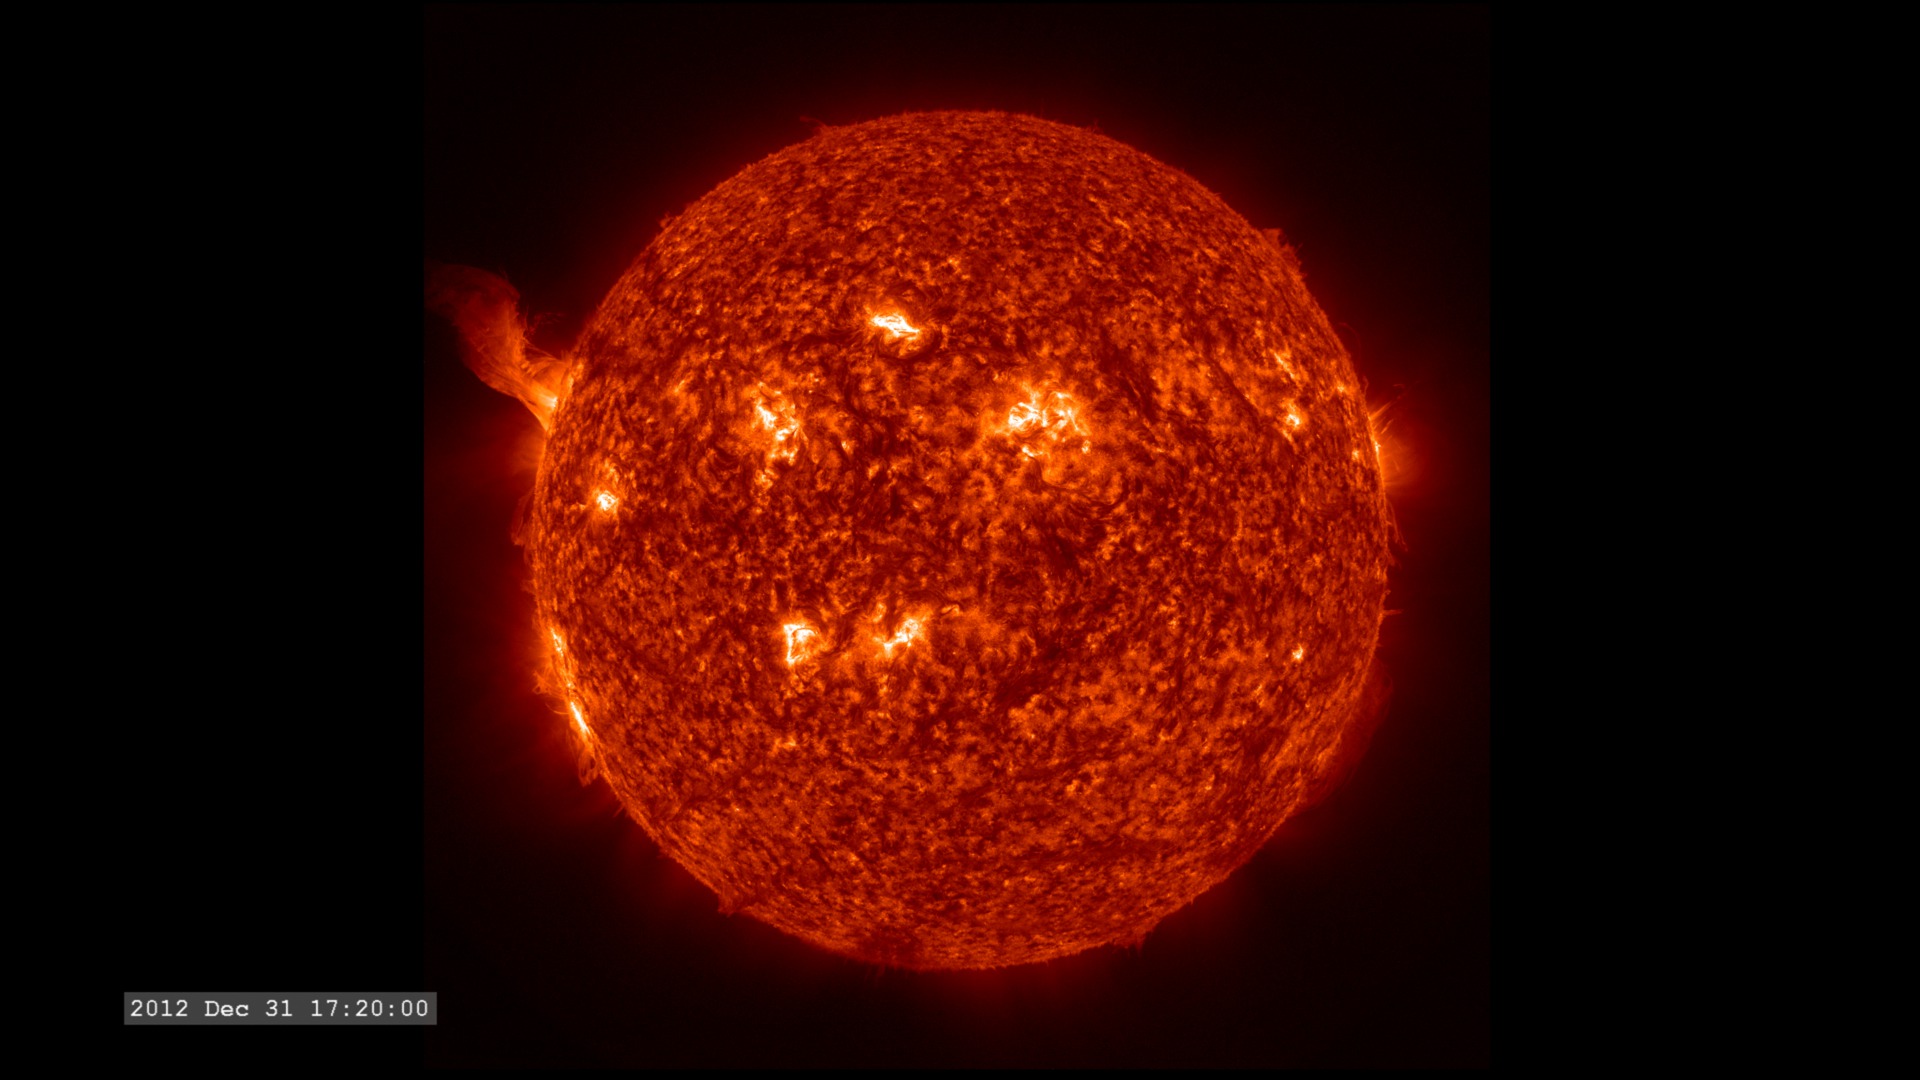
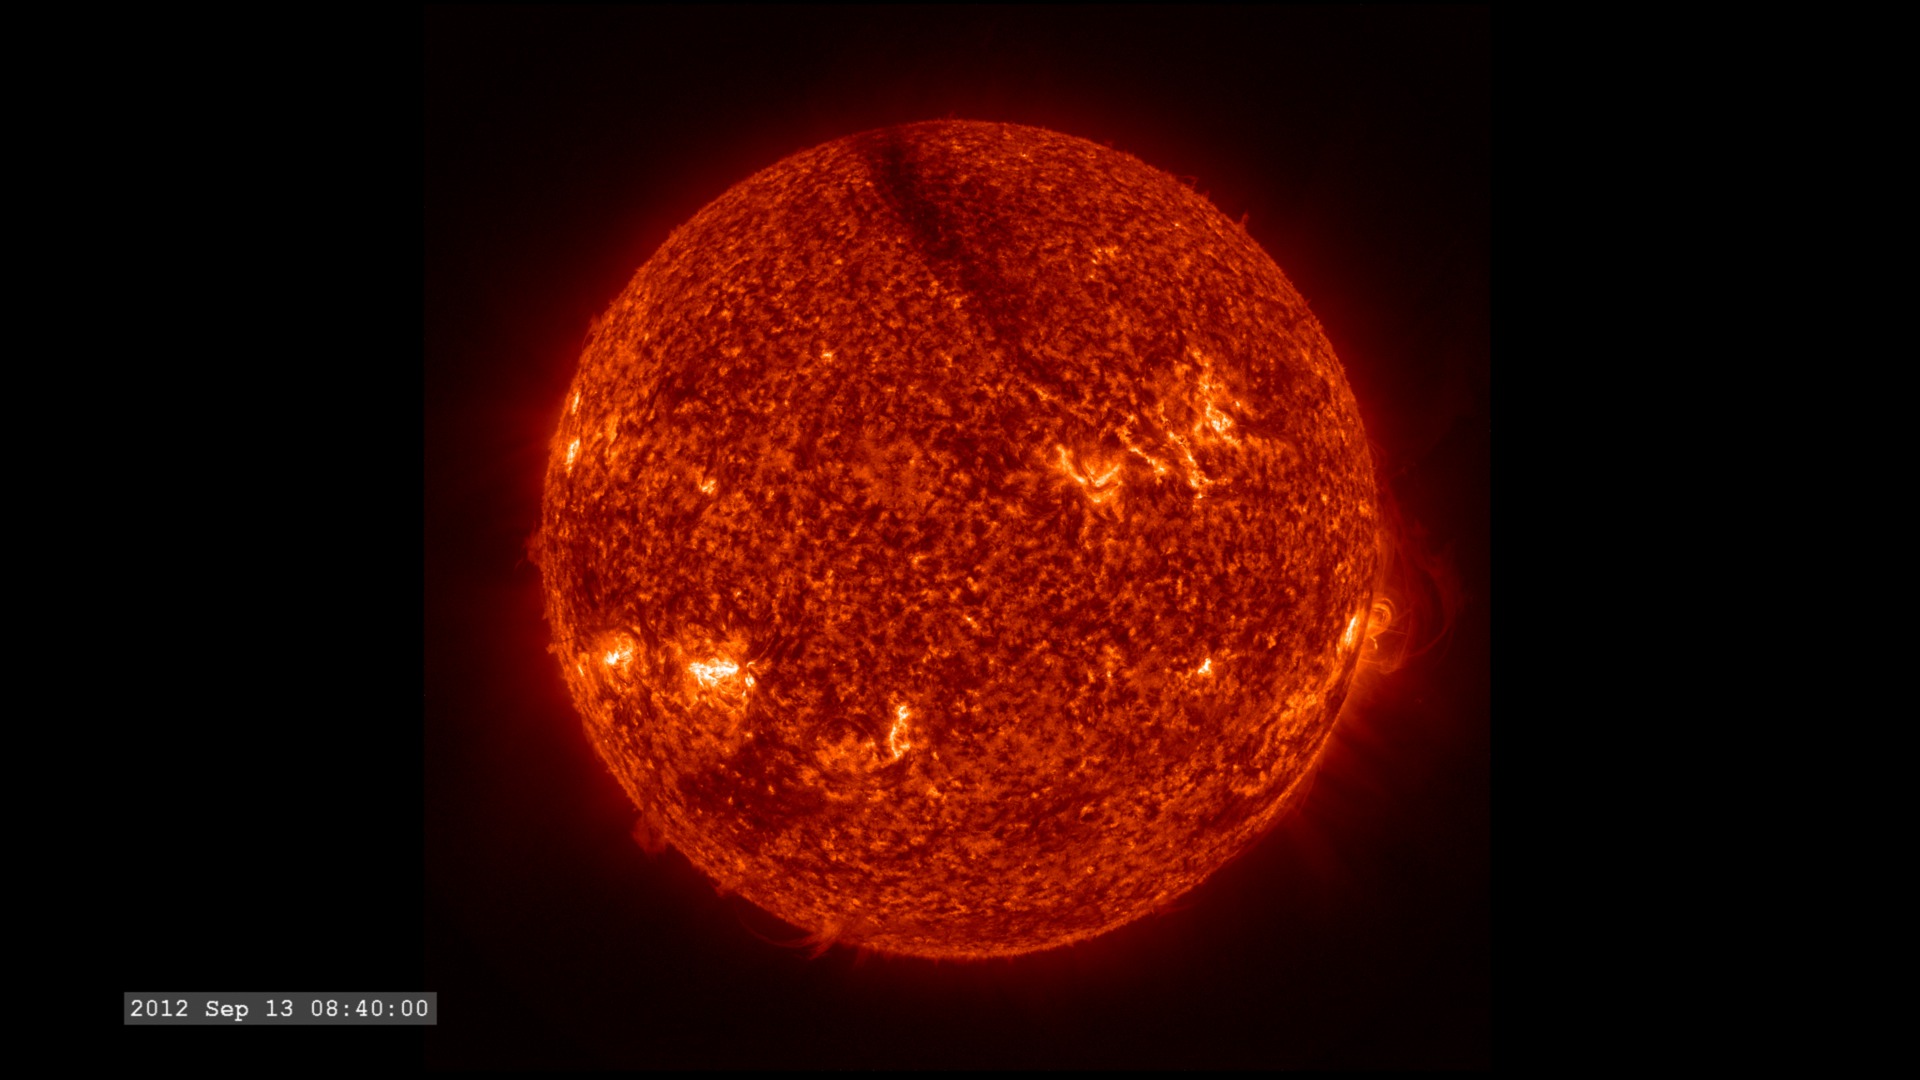
December 31, 2012 prominence in 304 angstrom light.
For More Information
Credits
Please give credit for this item to:
NASA's Goddard Space Flight Center/SDO
-
Animators
- Tom Bridgman (Global Science and Technology, Inc.)
- Scott Wiessinger (USRA)
-
Video editor
- Scott Wiessinger (USRA)
-
Narrator
- Karen Fox (ADNET Systems, Inc.)
-
Producer
- Scott Wiessinger (USRA)
-
Writers
- Scott Wiessinger (USRA)
- Karen Fox (ADNET Systems, Inc.)
Release date
This page was originally published on Monday, February 11, 2013.
This page was last updated on Tuesday, November 14, 2023 at 12:18 AM EST.
Missions
This visualization is related to the following missions:Series
This visualization can be found in the following series:Tapes
This visualization originally appeared on the following tapes:-
SDO: Year 3
(ID: 2013019)
Monday, February 11, 2013 at 5:00AM
Produced by - Robert Crippen (NASA)
Datasets used in this visualization
-
[SDO]
ID: 168This dataset can be found at: http://sdo.gsfc.nasa.gov/
See all pages that use this dataset -
SDO Continuum (Continuum) [SDO: HMI]
ID: 674 -
AIA 304 (304 Filter) [SDO: AIA]
ID: 677This dataset can be found at: http://jsoc.stanford.edu/
See all pages that use this dataset -
AIA 211 (211 Filter) [SDO: AIA]
ID: 678This dataset can be found at: http://jsoc.stanford.edu/
See all pages that use this dataset -
AIA 193 (193 Filter) [SDO: AIA]
ID: 679This dataset can be found at: http://jsoc.stanford.edu/
See all pages that use this dataset -
AIA 171 (171 Filter) [SDO: AIA]
ID: 680This dataset can be found at: http://jsoc.stanford.edu/
See all pages that use this dataset -
AIA 131 (131 Filter) [SDO: AIA]
ID: 730This dataset can be found at: http://jsoc.stanford.edu/
See all pages that use this dataset -
AIA 335 (335 Filter) [SDO: AIA]
ID: 748This dataset can be found at: http://jsoc.stanford.edu/
See all pages that use this dataset
Note: While we identify the data sets used in these visualizations, we do not store any further details, nor the data sets themselves on our site.
Related
- ID: 12625
- ID: 11742
 Produced Video
 - ID: 11745
 Produced Video
 - ID: 11473
 Produced Video
 - ID: 11460
 Produced Video
 - ID: 4026
 Visualization
 - ID: 4033
- ID: 4037
 Visualization
 - ID: 4038
 Visualization
 - ID: 4039
 Visualization
 - ID: 4027
 Visualization
 - ID: 3999
 Visualization
 - ID: 11120
 Produced Video
 - ID: 11095
 Produced Video
 - ID: 3963
 Visualization
 - ID: 11044
 Produced Video
 - ID: 3940
 Visualization
 - ID: 3941
 Visualization
 - ID: 10996
 Produced Video
 - ID: 3955
 Visualization
 - ID: 3945
 Visualization
 - ID: 10925
 Produced Video
 - ID: 3920
- ID: 10724
 Produced Video
Used as a Source In
- ID: 13859
![Music credits: “Swirling Blizzard” and “Endless Swirl” by Laurent Dury [SACEM] from Universal Production Music Watch this video on the NASA Goddard YouTube channel.Complete transcript available.](/vis/a010000/a013800/a013859/13859_SDOColors.00700_print.jpg) Produced Video
Produced Video