Cool Migration
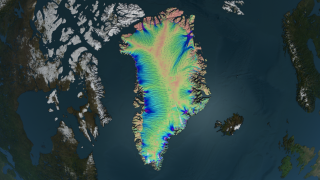
The world's second largest ice sheet seems uniform and motionless from above. But years of satellite measurements compressed into a few seconds illustrate just how fluid Greenland's ice really is. Several space agencies, including NASA, have closely monitored the ice sheet to understand how its dynamics might be influenced by changes to Earth's climate and how such changes could affect sea level rise. With the help of a remote sensing technique called radar interferometry, NASA scientists were able to create the first complete map that shows how Greenland's ice moves from the interior toward outlet glaciers on the coast. The speed and direction of the flows can be seen in the color-coded visualization, where areas shaded blue and purple represent the fastest ice, yellow and pink the slowest.

Watch ice journey across Greenland's massive ice sheet.
NASA scientist Eric Rignot provides a narrated tour of Greenland's moving ice sheet.
Ice in the Northeast Greenland Ice Stream can travel more than 500 meters each year.
Ice near the center ridge of Greenland's ice sheet flows just a few meters each year.
On Greenland's west coast, outlet glaciers like Jakobshavn can flow several kilometers each year.
Greenland's surface appears smooth where ice flows slowly. Areas with deep cracks called crevasses (foreground) indicate faster flows.
Greenland's ice becomes heavily crevassed as it flows over the varied underlying terrain near the coast.
Crevasses can form wide gaps and drop tens of meters below the surface.
Credits
Please give credit for this item to:
NASA's Goddard Space Flight Center
Greenland photos courtesy of NASA/GSFC/Jefferson Beck
-
Animators
- Cindy Starr (Global Science and Technology, Inc.)
- Horace Mitchell (NASA/GSFC)
- Greg Shirah (NASA/GSFC)
-
Narrator
- Eric J. Rignot (NASA/JPL CalTech)
-
Producers
- Jefferson Beck (USRA)
- Alan Buis (NASA/JPL CalTech)
-
Scientists
- Eric J. Rignot (NASA/JPL CalTech)
- Jeremie Mouginot (University of California, Irvine)
- Ian Howat (Ohio State University)
- Ted Scambos (NSIDC)
-
Writer
- Jefferson Beck (USRA)
Release date
This page was originally published on Tuesday, August 21, 2012.
This page was last updated on Wednesday, May 3, 2023 at 1:52 PM EDT.
Related
- ID: 3962
 Visualization