Data Gazing
- Written by:
- Patrick Lynch
- View full credits

Images
- 1024_dubai.jpg (1024x576)
- 1280_dubai.jpg (1280x720)
- 1024_dubai_web.png (320x180)
Right click movies to download them if they automatically play in your browser.
Blink and you would have missed construction of the palm-shaped island off the coast of Dubai.

Images
- 1024_ice_flows.jpg (1024x576)
- 1280_ice_flows.jpg (1280x720)
- 1024_ice_flows_web.png (320x180)
Right click movies to download them if they automatically play in your browser.
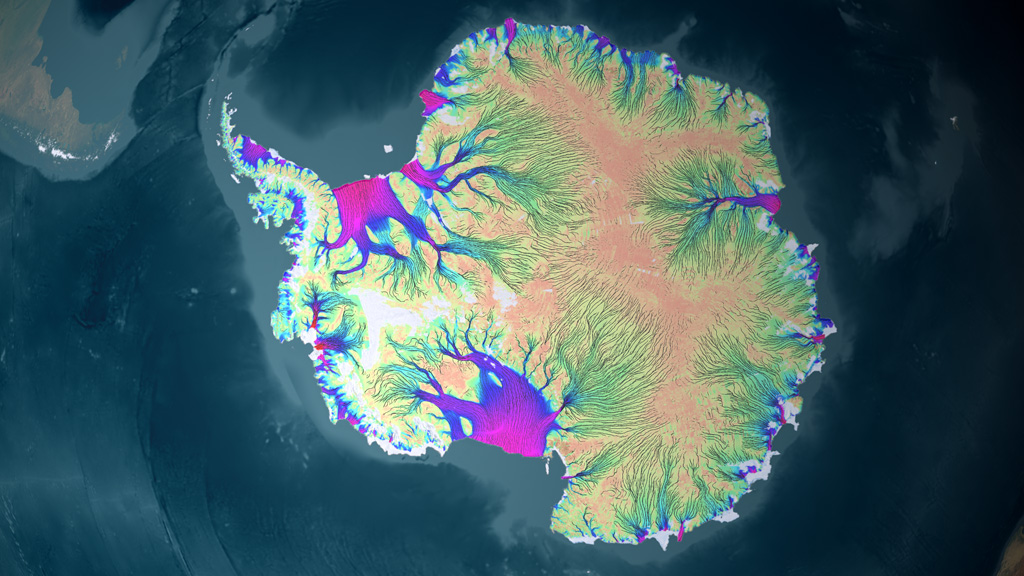
Antarctica's migrating ice resembles a connected system of capillaries, veins and arteries.

Images
- 1024_moon_struck.jpg (1024x576)
- 1280_moon_struck.jpg (1280x720)
- 1024_moon_struck_web.png (320x180)
Right click movies to download them if they automatically play in your browser.
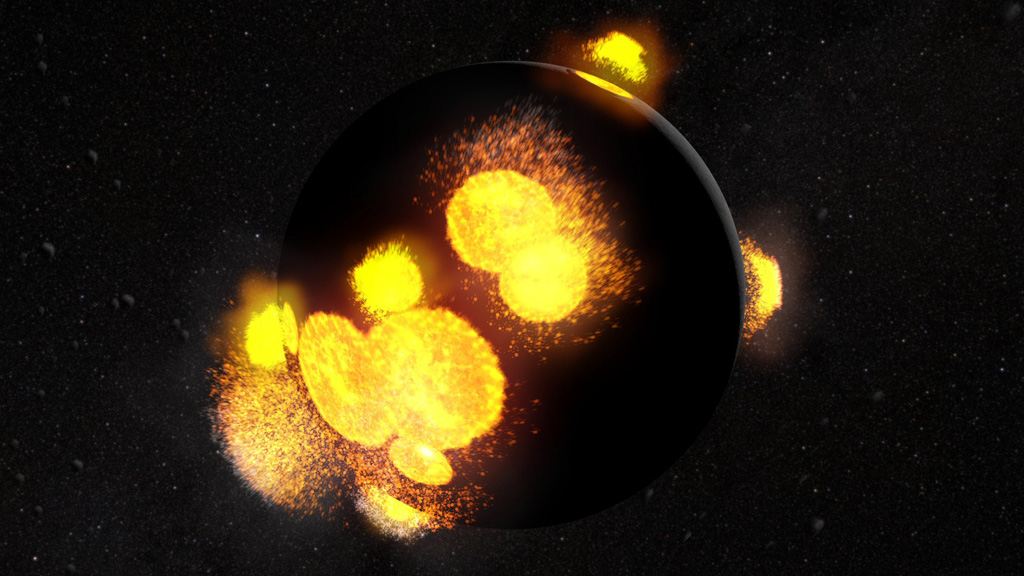
Growing pains: As a kid the moon was covered in liquid hot magma.

Images
- 1024_super_blooms.jpg (1024x576)
- 1280_super_blooms.jpg (1280x720)
- 1024_super_blooms_web.png (320x180)
Right click movies to download them if they automatically play in your browser.
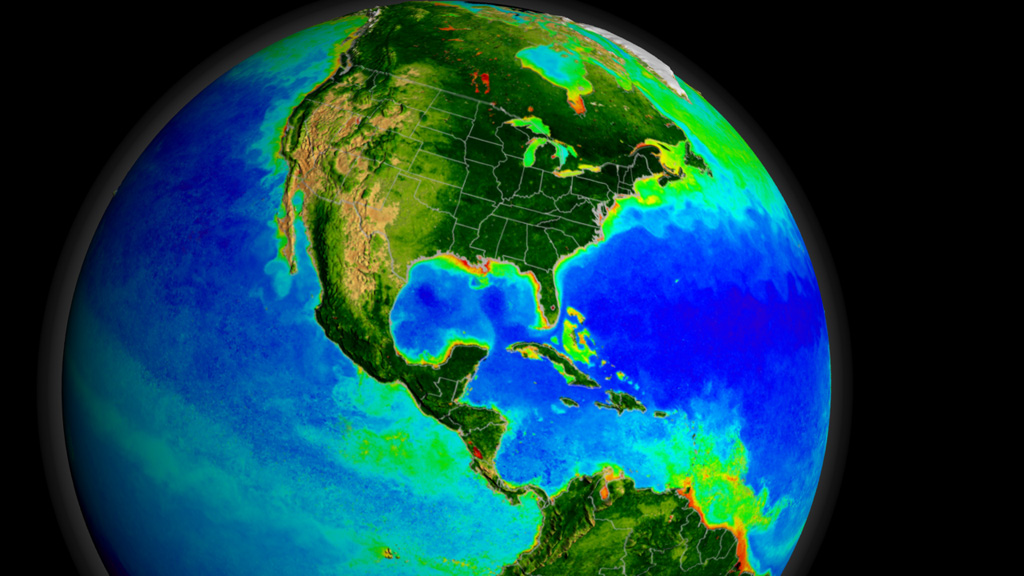
You could use a microscope to see one or two phytoplankton—or a satellite to view entire colonies.

Images
- 1024_visions.jpg (1024x576)
- 1280_visions.jpg (1280x720)
- 1024_visions_web.png (320x180)
Right click movies to download them if they automatically play in your browser.
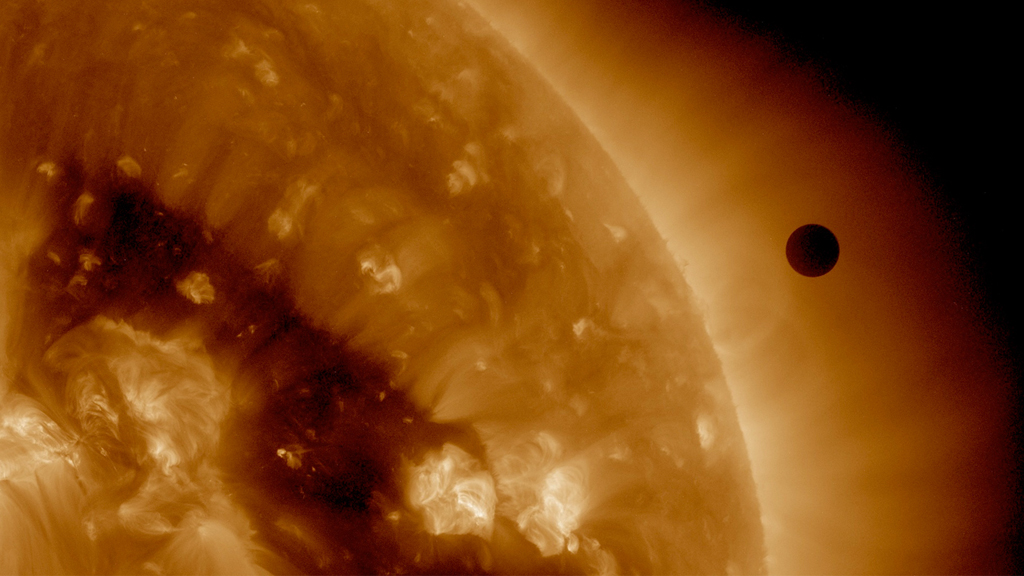
Is it a bird? A plane? A hole punched in space? No. It's just Venus crossing the sun.

Images
- Mosaic_1024x576.jpg (1024x576)
- Mosaic_1920x1080.jpg (1920x1080)
- Mosaic_1024x576_thm.png (80x40)
- Mosaic_1024x576_web.png (320x180)
Right click movies to download them if they automatically play in your browser.
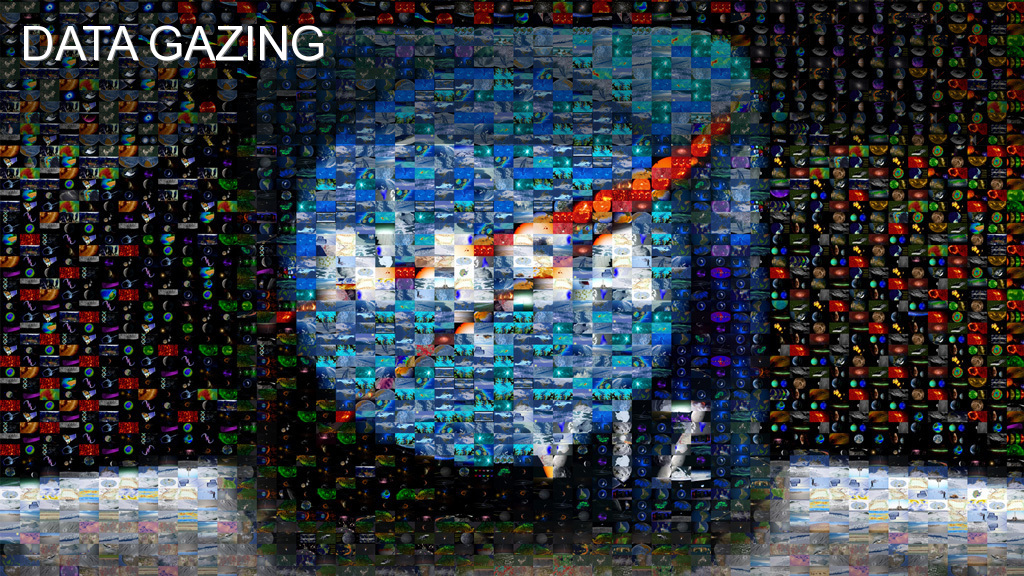
Exploring the universe bit by bit.
Movies
- Anniversary-540-MASTER_high.mp4 (960x540)
- Anniversary-540-MASTER_high.webmhd.webm (960x540)
Images
- Nasaviz_coverscollage_1024x576.jpg (1024x576)
- Nasaviz_coverscollage_1920x1080.jpg (1920x1080)
Files
- a011015_iPad_movie_Anniversary-540-MASTER/Anniversary-540-MASTER.m3u8
Right click movies to download them if they automatically play in your browser.
Science you can groove to: Turn up the volume on this NASA Viz music video.
Credits
Please give credit for this item to:
NASA's Goddard Space Flight Center
Dubai image courtesy of NASA Earth Observatory
Writer
- Patrick Lynch (NASA/GSFC) [Lead]
Video editor
- Kayvon Sharghi (USRA)
Producer
- Kayvon Sharghi (USRA)
Related pages
NASA Visualization Explorer
Aug. 1, 2012, 4 a.m.
Read moreIn 2011, we released an app for the iPad called and began delivering two visualization-based science stories per week to users of the app. This animation shows the cover images of these stories, in the order of their release. The first year of stories released on NASA Visualization Explorer. For More InformationSee [http://svs.gsfc.nasa.gov/nasaviz/index.html](http://svs.gsfc.nasa.gov/nasaviz/index.html)
Mystery Belts
July 18, 2012, 8 p.m.
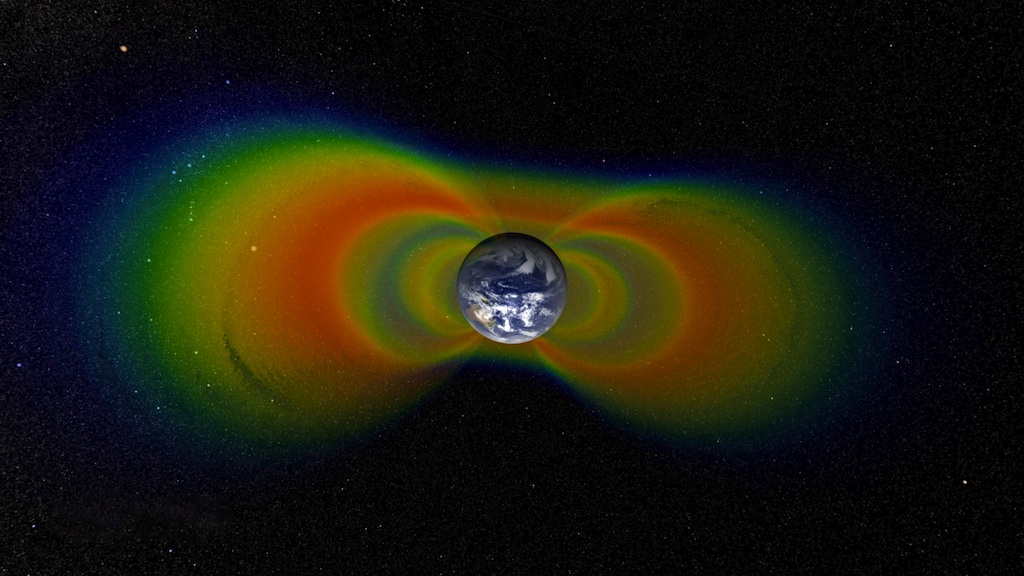
Read moreTwo regions of fast, energetic particles surround the planet with plasma and scientific questions. This cutaway view illustrates changes in the belts s upcoming Radiation Belt Storm Probes (RBSP) mission seek to determine what forces make the belts shrink and swell. The two RBSP spacecraft will fly in extreme elliptical orbits, allowing the mission to observe changes in the belts from different perspectives. For More InformationSee [NASA.gov](http://www.nasa.gov/mission_pages/rbsp/news/electric-atmosphere.html)
A Star's Spiral
June 25, 2012, 8 p.m.
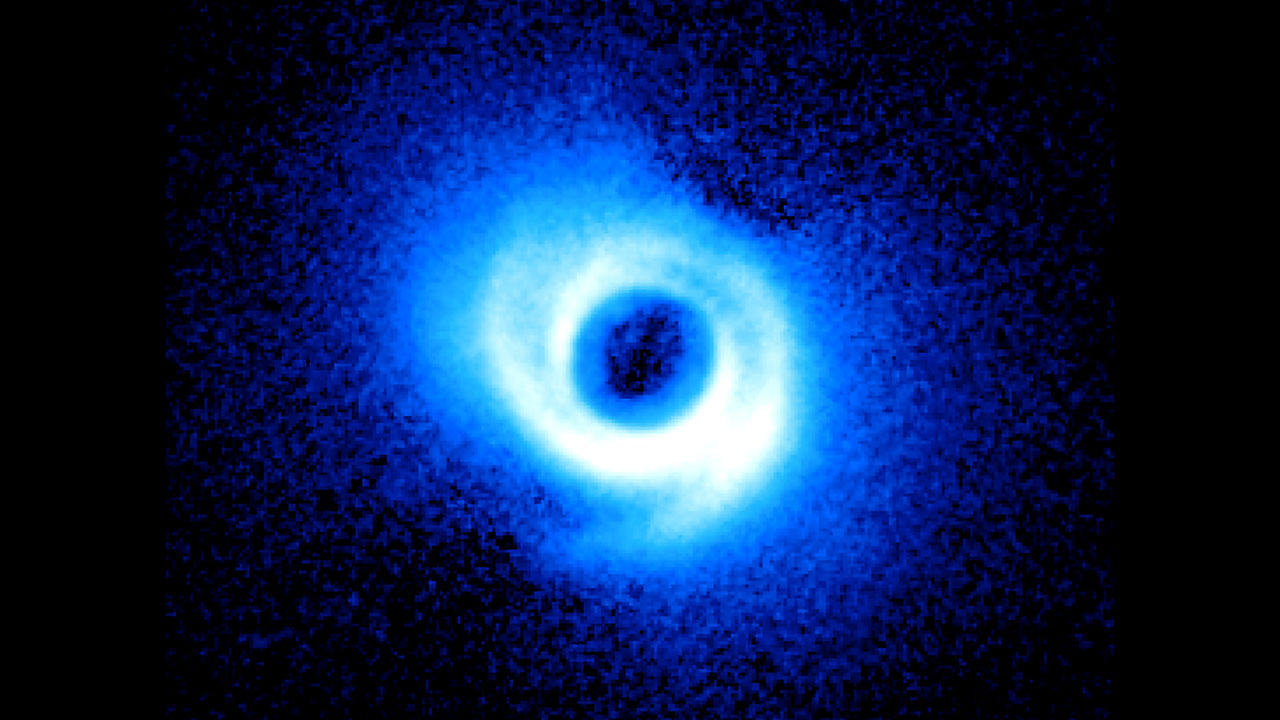
Read moreWhat created the unusual spiral arms surrounding this star? The asymmetric nature of the arms in the image of star SAO 206462 could mean that the disk contains at least two planets. This video compares a visualization of a planet-forming star from the NCSA Advanced Visualization Lab to the new image of SAO 206462. Two spiral arms emerge from SAO 206462 s orbit. The Subaru Telescope (center) on the summit of Mauna Kea, Hawaii, was used to spot SAO 206462. For More InformationSee [Science@NASA](http://science.nasa.gov/science-news/science-at-nasa/2011/31oct_spiralarms/)
Visions Of Venus
June 6, 2012, 8 p.m.
Read moreNow for the good stuff! See unprecedented views of Venus crossing the sun. Venus appears as a perfect black dot in this collection of SDO images captured at multiple wavelengths. The NASA/ESA Solar and Heliospheric Observatory tracked Venus from May 31 to June 4 as the planet approached the sun. Venus crossed the left limb of the sun, seen here at 304 angstroms, between 6 and 7 p.m. EDT on June 5. Venus prepares to exit over the right side of the sun, shown here at 171 angstroms, following a transit of six and a half hours. Backlit by the sun, seen here at 193 angstroms, Venus completes its last transit until 2117. For More InformationSee [NASA.gov](http://www.nasa.gov/topics/solarsystem/venus_images.html)
Super Blooms
May 7, 2012, 8 p.m.
Read moreMarine plants multiply and take over the seas. Red, orange, yellow and green represent areas where blooms abound. Blue patches represent nutrient-poor zones where blooms exist in low numbers. The upwelling of nutrient-rich waters off the coast of California provide phytoplankton with essential minerals, allowing massive blooms to form. Similar upwelling events yield dense blooms off North Africa s Aqua satellite.
Rattling Earth's Force Field
April 23, 2012, 8 p.m.
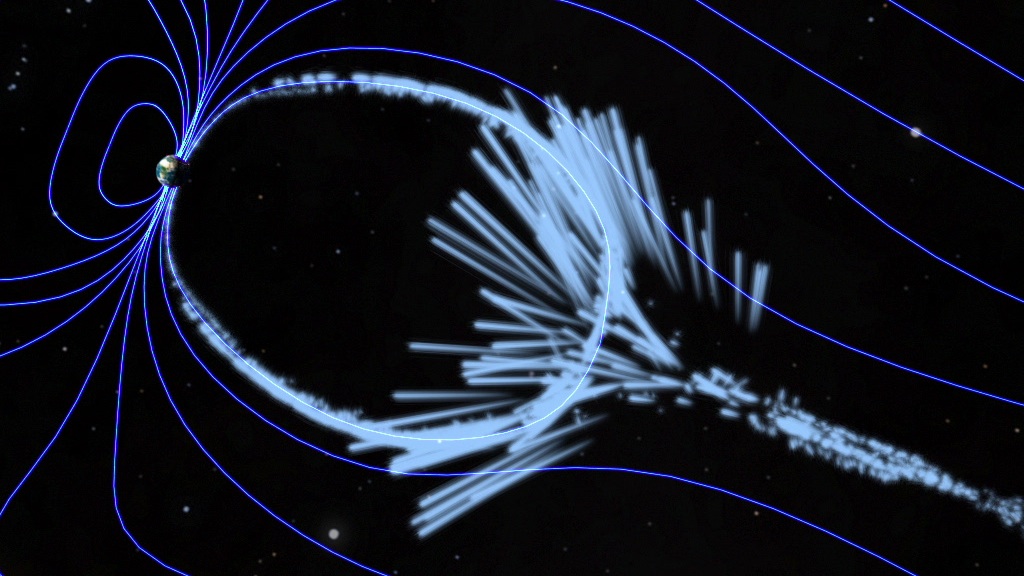
Read moreHow massive solar eruptions rock our atmosphere. Magnetic field lines, collectively known as the magnetosphere, surround Earth. An artist s magnetosphere. Energy funneled along compressed magnetic field lines creates auroras when the energized lines intersect. This aurora, photographed in Finland, was a beautiful side effect of a geomagnetic storm in February 2012.
Moon Struck
March 14, 2012, 8 p.m.
Read moreThe brutal secret of how the moon got the scarred face we know and love. Take a tour of stunning new views of the moon s Shackleton crater, but its cold depths may not have seen light for 2 billion years. Because Tycho crater is young, the 1-mile-tall peaks at its center are still sharp and imposing. For More InformationSee [NASA.gov](http://www.nasa.gov/mission_pages/LRO/news/vid-tour.html)
Galactic Lobes
Feb. 29, 2012, 7 p.m.
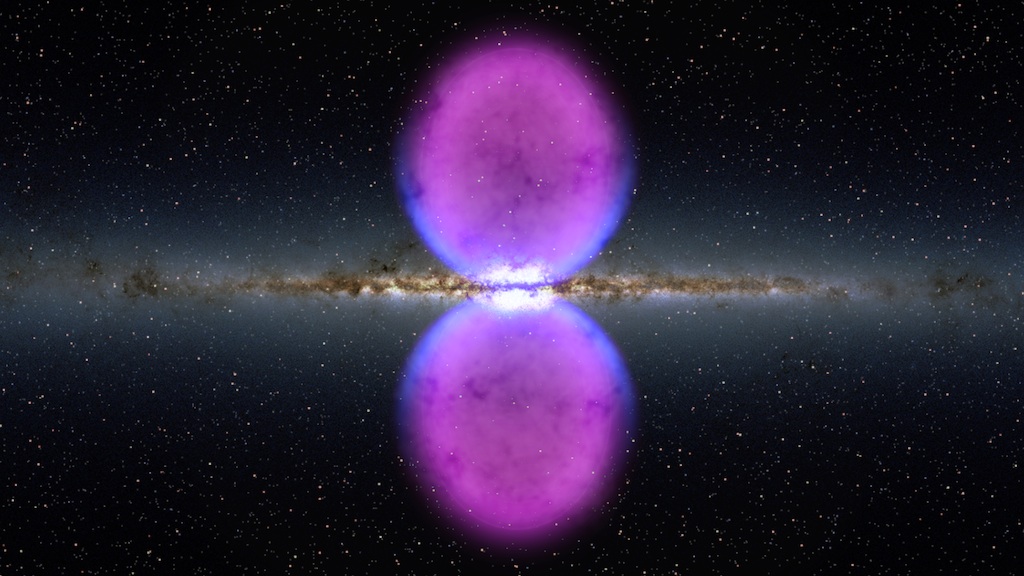
Read moreGamma rays radiate from the Milky Way s sharp edges suggest it formed in a sudden, impulsive event. From end to end, the lobes stretch 50,000 light years, or about half the diameter of the Milky Way. For More InformationSee [NASA.gov](http://www.nasa.gov/mission_pages/GLAST/news/new-structure.html)
"Alien" Material
Feb. 27, 2012, 7 p.m.
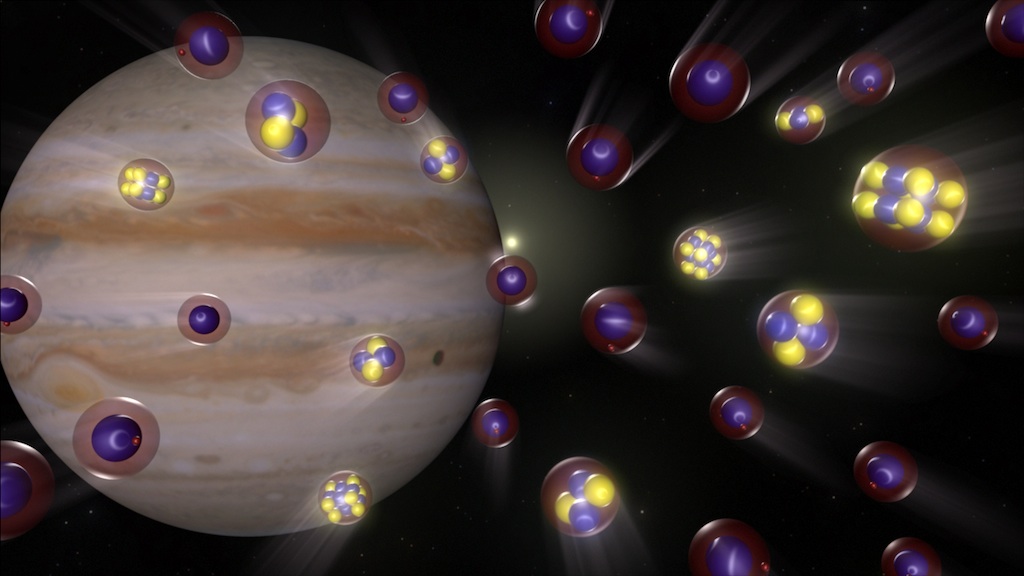
Read moreUnderstanding the material from beyond our solar system tells of our past and evolution. The solar system and the heliosphere move through wispy interstellar clouds made of hydrogen, helium, neon and oxygen. Charged interstellar particles ricochet away, but neutral atoms slip through the bubble of solar wind called the heliosphere. Interstellar material emanates from stellar nurseries such as the Orion nebula, captured here by the Hubble Space Telescope. Atoms from beyond the solar system travel three decades to reach IBEX in its orbit between Earth and the moon. IBEX orbits Earth about three-quarters of the way to the moon to avoid magnetic interference from Earth. For More InformationSee [NASA.gov](http://www.nasa.gov/mission_pages/ibex/news/interstellar-difference.html)
Untitled
Feb. 1, 2012, 7 p.m.
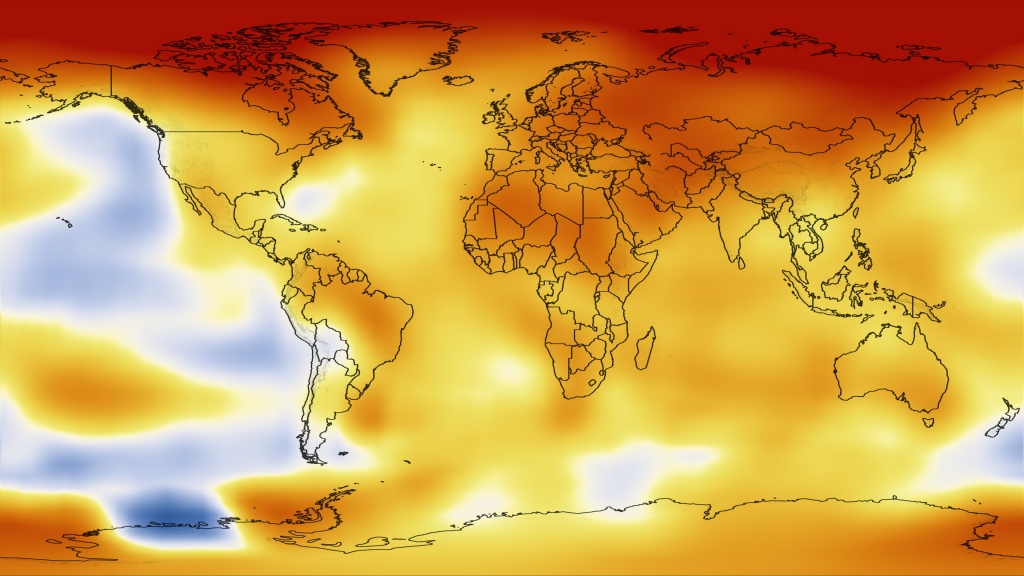
Read moreHuman influence on global temperature continued in 2011 (seen here). NASA scientists said the year was the ninth warmest on record. Global temperature is one of the basic measuring sticks of climate change. The planet is now warming by about 0.36 degrees Fahrenheit per decade. The world was a cooler place in 1951, the first year of a 30-year baseline period used in the NASA temperature record. The 1991 Mt. Pinatubo eruption in the Phillipines released so much sunlight-reflecting ash that the warming trend briefly slowed in the mid-1990s. But by 1998, the strongest El Nino of the century drove global temperatures to a new record high. The years 2010 and 2005 remain tied for the hottest years, but they are only about 0.2 degrees Fahrenheit warmer than 2011, the ninth warmest year. The colors represent how much the first and last years in the NASA record depart from the average temperature between 1951 and 1980. For More InformationSee [NASA.gov](http://www.nasa.gov/topics/earth/features/2011-temps.html)
Antimatter Explosions
Jan. 30, 2012, 7 p.m.
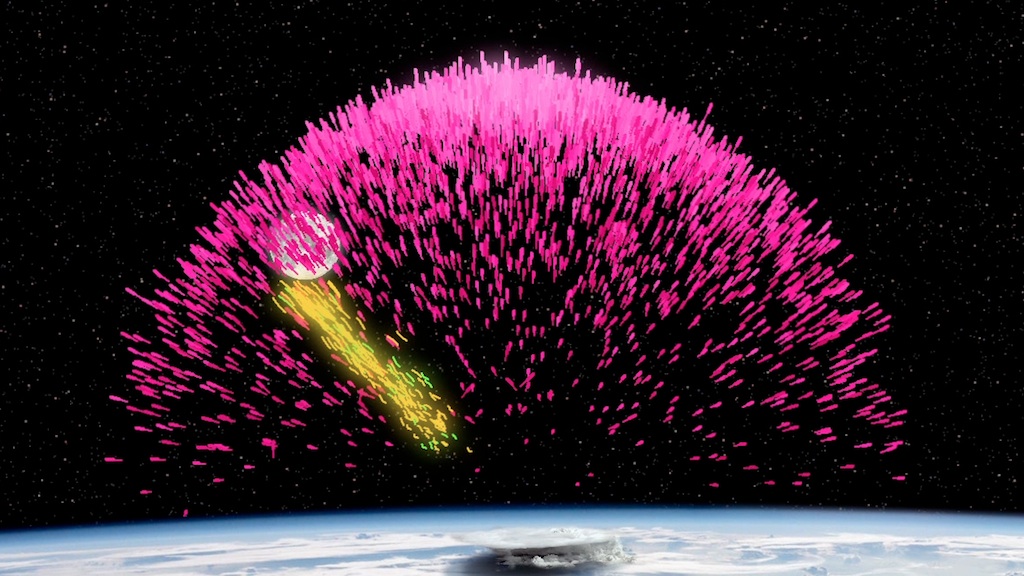
Read moreA NASA spacecraft discovers antimatter bursts released by thunderstorms. There are some 500 terrestrial gamma-ray flashes daily. The red dots show those Fermi spotted through 2010. Learn how scientists used Fermi s representation shows how a cloud of electrons and positrons passed over Fermi and caused it to emit gamma rays. For More InformationSee [NASA.gov](http://www.nasa.gov/mission_pages/GLAST/news/fermi-thunderstorms.html)
Dubai's Rapid Growth
Jan. 16, 2012, 7 p.m.
Read moreWitness the extravagant transformation of Dubai s growth at one frame per year from 2000 through 2011. The first signs of construction of Palm Jumeirah appeared in early 2002. By late 2002 the palm tree shape had begun to emerge. The island was completed in 2003. As buildings and roads grew on the new island, the city expanded onshore. Irrigated, plant-covered land (red) covered a greater area in 2006. By 2011, most of the land was developed, covered in city blocks (gray), residential areas (red and gray), and resorts (mostly red). For More InformationSee [NASA Earth Observatory](http://earthobservatory.nasa.gov/Features/WorldOfChange/dubai.php?src=vizapp)
Magnetic Hotspots
Dec. 21, 2011, 7 p.m.
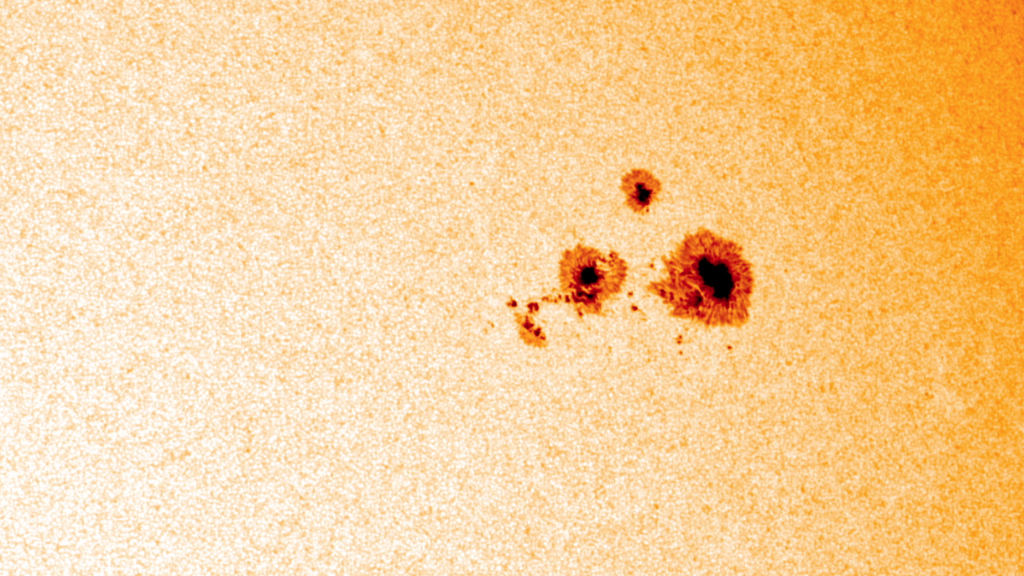
Read moreLike clockwork, dark spots the size of Earth speckle our sun. Traveling sunspots are seen by NASA s magnetic field lines get more complex as the magnetic material inside stretches and twists. Eleven years in the life of the sun, progressing from solar minimum (upper left) to maximum and back to minimum (upper right) again. For More InformationSee [NASA.gov](http://www.nasa.gov/mission_pages/sunearth/news/solarcycle-primer.html)
Bubbles At The Edge Of The Solar System
Nov. 23, 2011, 7 p.m.
Read moreNASA s edge. Scientists once thought the border of the heliosheath, seen in blue, had a smooth surface. Scientists now know magnetic bubbles pile up at the edge of the solar system, as seen here. For More InformationSee [NASA.gov](http://www.nasa.gov/mission_pages/voyager/heliosphere-surprise.html)
Perpetual Ocean
Nov. 9, 2011, 7 p.m.
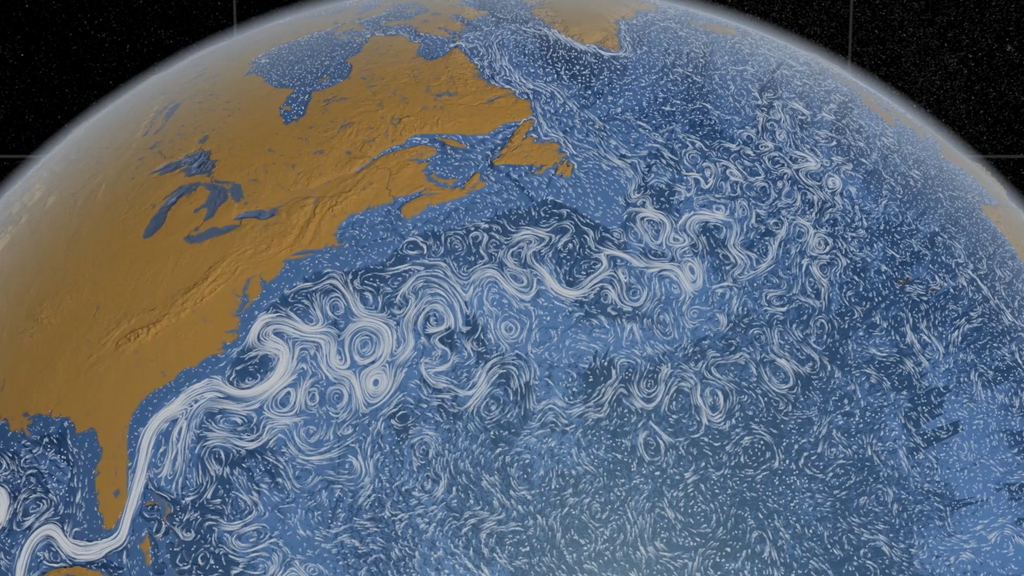
Read moreWatch surface currents circulate in this high-resolution, 3D model of the Earth s oceans. Distinctive white lines trace the flow of surface currents around the world. The Gulf Stream carries warm water from the eastern coastline of the United States to regions of the North Atlantic Ocean. The Agulhas Current travels along the coastline of Mozambique and South Africa and then loops eastward. The Kuroshio Current flows northeast off the coast of Japan transporting warm ocean water circulating east of Taiwan. For More InformationSee [NASA.gov](http://www.nasa.gov/topics/earth/features/perpetual-ocean.html)
Antarctic Ice Flow Charted From Space
Aug. 24, 2011, 8 p.m.
Read moreHarsh snows have blanketed Antarctica for so long that the continent has built up an ice sheet a mile thick from bedrock to surface in most places. Despite the ice cap s grip on the rocky landmass below, friction can only hold back the ice so much. A new, first-of-its-kind map from NASA reveals icy Antarctica as a landscape of constant movement. NASA scientists at the Jet Propulsion Laboratory and UC Irvine have charted this movement for the first time, using Canadian, Japanese and European satellite data to create a record of the speed and direction of ice flow across the entire continent. The map reveals glaciers and tributaries in patterned flows stretching hundreds of miles inland, like a system of rivers and creeks. Slow-moving flows found in largely unexplored East Antarctica defied previous understanding of ice migration. And scientists discovered a ridge that splits Antarctica from east to west. Explore the visualizations below to see the new benchmark map scientists can use to study the extent and speed of changes to the largest ice sheet in the world. A new map changes our understanding of how ice flows across Antarctica. Slow, interior flows have been sped up to make them more visible. The colors represent the real flow velocity magnitude.This video is also available on our YouTube channel. With all flows shown at the proper scale, only the fastest ice movement is visible. With colors representing velocity magnitude removed, glacier direction stands out against the icy background. Black lines mark continental ridges that separate regions of ice moving toward different parts of the coastline. For More InformationSee [NASA.gov](http://www.nasa.gov/topics/earth/features/antarctica20110818.html)
A Pinch Of Salt From Space
Aug. 22, 2011, 8 p.m.
Read moreWhat does salinity have to do with ocean currents and climate change? Aquarius orbit and swath of salinity measurements will provide complete coverage of the oceans every seven days. The impact of salinity on deep ocean circulation makes it a crucial climate influence to measure. Rainfall differences make the Atlantic saltier than the Pacific, seen in lighter versus darker areas of this salinity map based on ship data.
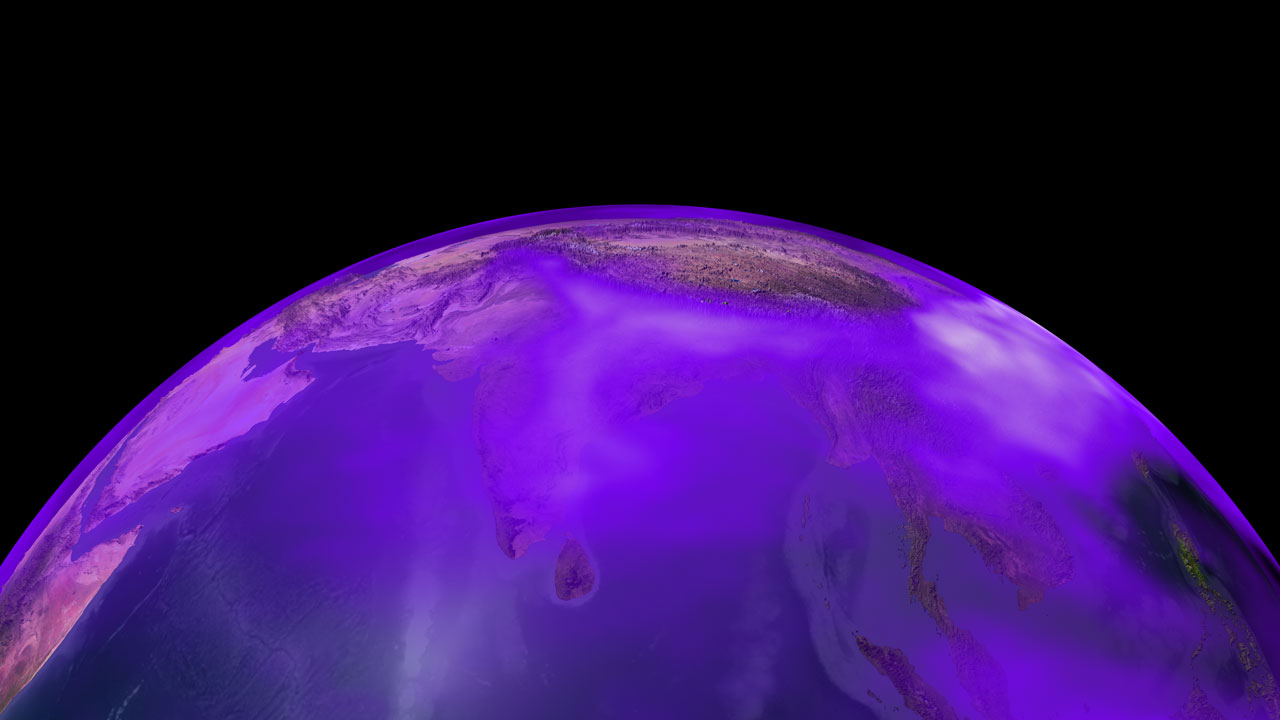
Black Carbon: Asia's Plain Of Air Pollution
Aug. 10, 2011, 8 p.m.
Read moreA region t do it all. Here, scientists trek into the Himalayas to collect ice cores that contain soot layers dating back to the 1950s. Dark layers, comprised mainly of black carbon and dust, are clearly visible as a scientist explores a crevasse on Mera glacier in Nepal. For More InformationSee [NASA.gov](http://www.nasa.gov/topics/earth/features/himalayan-warming.html)
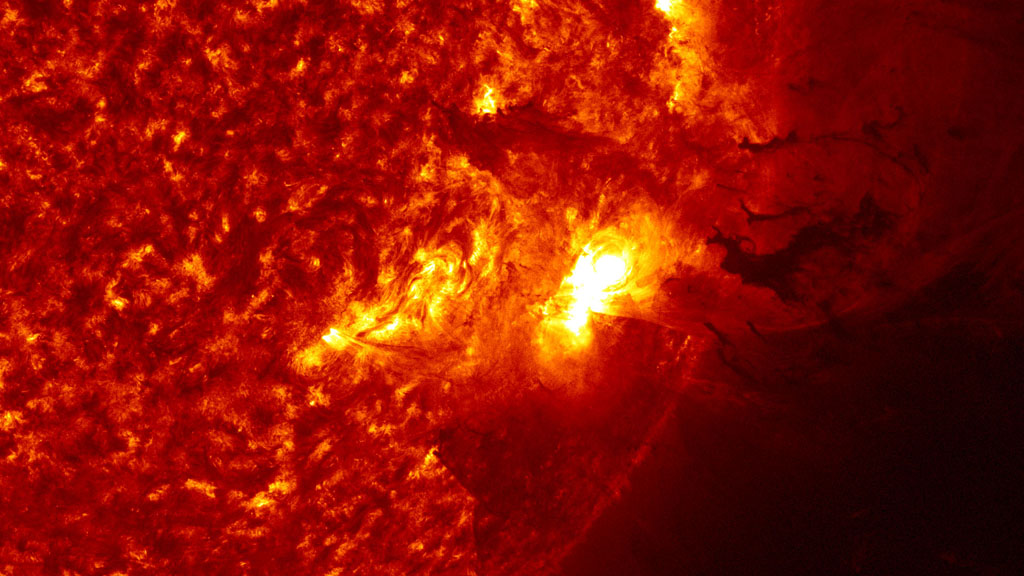
Extreme Solar Eruption Caught On Camera
Aug. 1, 2011, 8 p.m.
Read moreHot plasma leaps from the sun in stunning HD. Viewing the event at multiple wavelengths reveals plasma of different temperatures in the solar eruption. At 4096 by 4096 pixels, SDO takes some of the largest images of the sun that the world plasma (dark green) rises in the solar atmosphere. Earth is shown in approximate scale to a previous solar eruption that took place on Mar. 30, 2010. For More InformationSee [NASA.gov](http://www.nasa.gov/mission_pages/sunearth/news/dark-fireworks.html)