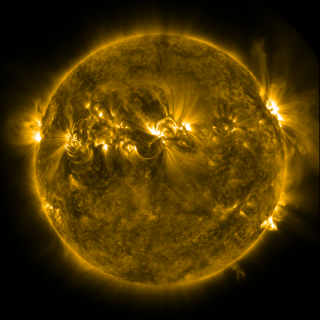
Incandescent Sun
This video takes SDO images and applies additional processing to enhance the structures visible. While there is no scientific value to this processing, it does result in a beautiful, new way of looking at the sun. The original frames are in the 171 angstrom wavelength of extreme ultraviolet. This wavelength shows plasma in the solar atmosphere, called the corona, that is around 600,000 Kelvin. The loops represent plasma held in place by magnetic fields. They are concentrated in "active regions" where the magnetic fields are the strongest. These active regions usually appear in visible light as sunspots. The events in this video represent 24 hours of activity on September 25, 2011.

Still of east limb active region.

Still of central "peacock" active region.

Still of west side CME in progress.

Still of west limb active region.

Still of lower east limb CME in progress.

Most of the disk of the sun.

Wallpapers
A selection of stills sized for desktop backgrounds. Each one is available as a TIFF or JPEG.
Credits
Please give credit for this item to:
NASA/Goddard Space Flight Center
-
Animators
- Tom Bridgman (Global Science and Technology, Inc.)
- Scott Wiessinger (USRA)
-
Video editor
- Scott Wiessinger (USRA)
-
Producer
- Scott Wiessinger (USRA)
Release date
This page was originally published on Wednesday, May 23, 2012.
This page was last updated on Wednesday, May 3, 2023 at 1:53 PM EDT.
Missions
This visualization is related to the following missions:Series
This visualization can be found in the following series:Tapes
This visualization originally appeared on the following tapes:-
Art Sun
(ID: 2012050)
Tuesday, May 29, 2012 at 4:00AM
Produced by - Robert Crippen (NASA)
Datasets used in this visualization
-
[SDO]
ID: 168This dataset can be found at: http://sdo.gsfc.nasa.gov/
See all pages that use this dataset -
AIA 171 (171 Filter) [SDO: AIA]
ID: 680This dataset can be found at: http://jsoc.stanford.edu/
See all pages that use this dataset
Note: While we identify the data sets used in these visualizations, we do not store any further details, nor the data sets themselves on our site.
