NASA's Lunar Reconnaissance Orbiter Brings "Earthrise" to Everyone
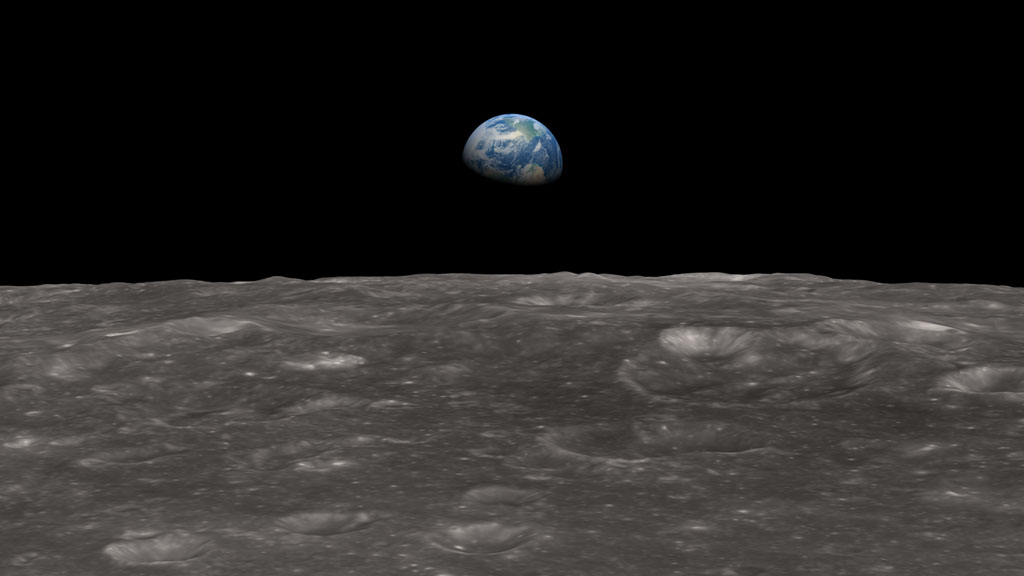
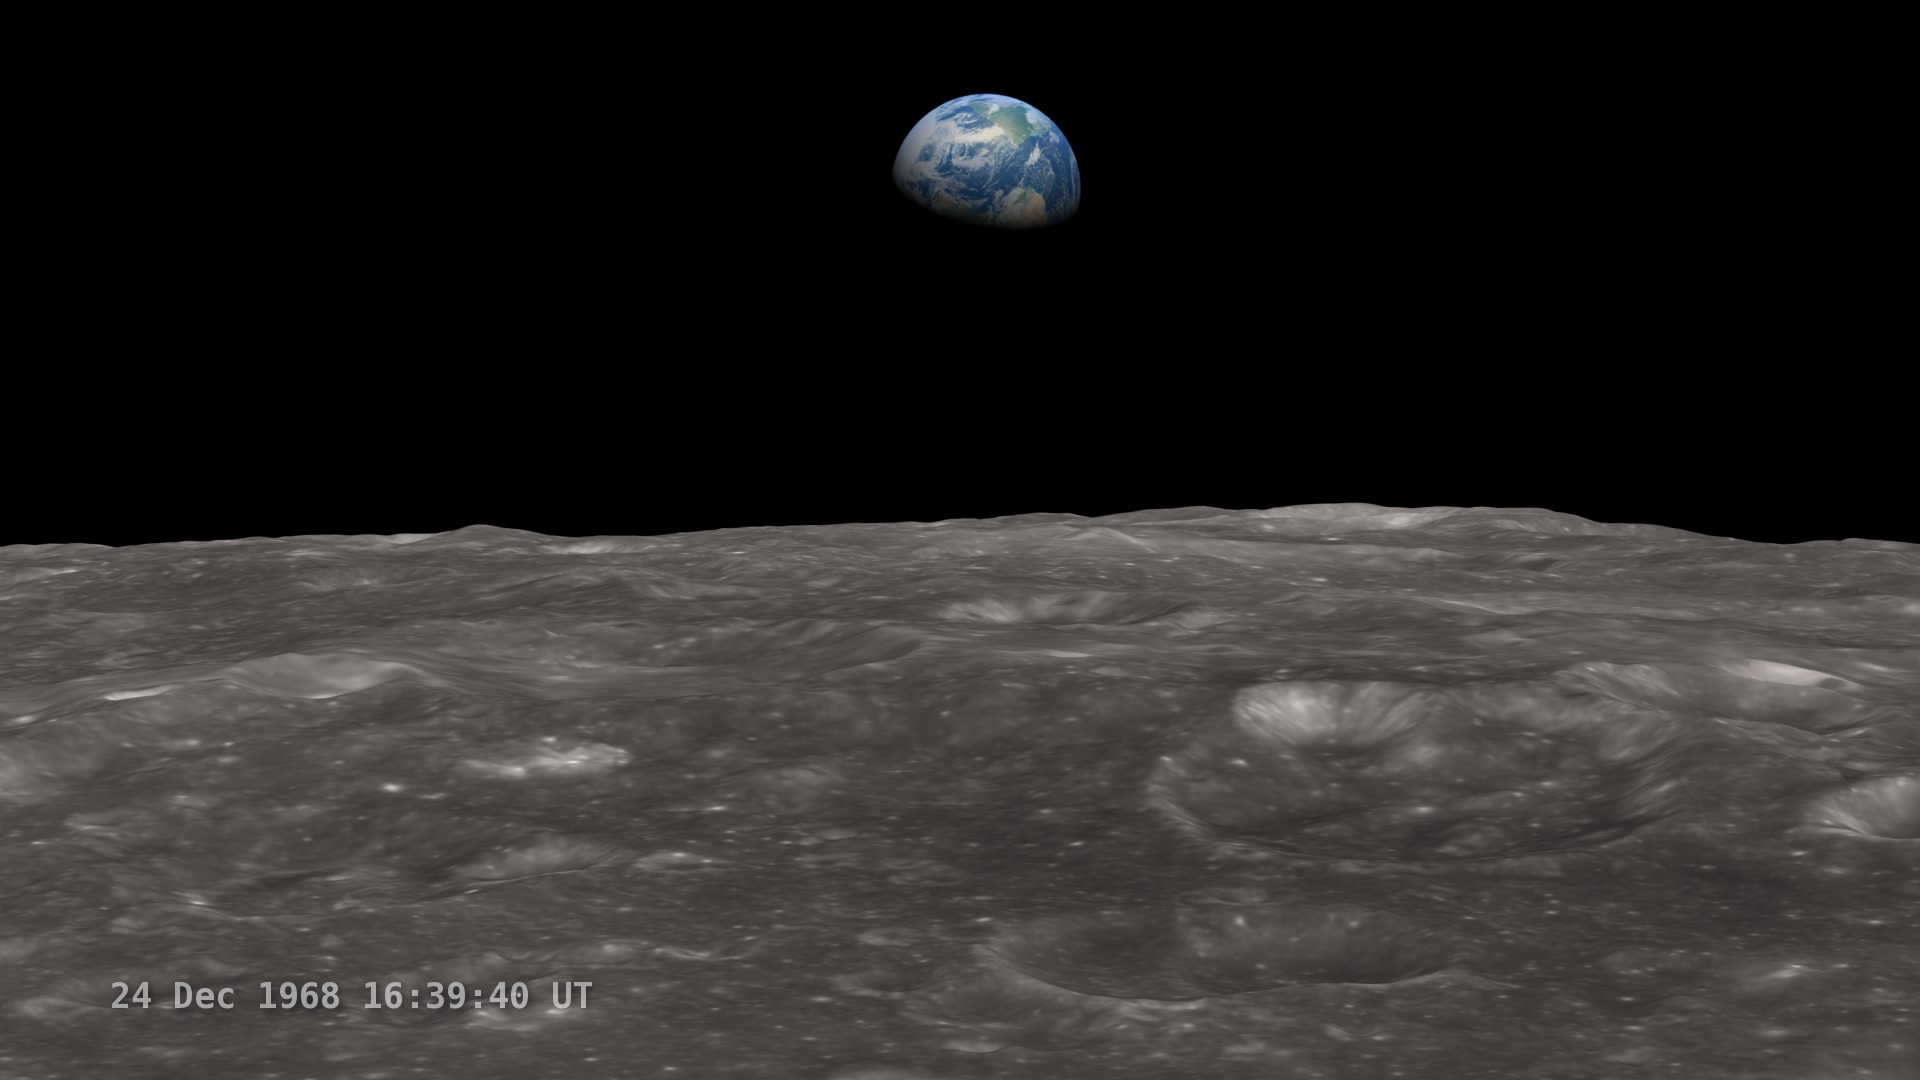
On December 24, 1968, Apollo 8 Commander Frank Borman and crew members William A. Anders and James A. Lovell, Jr. became the first humans to photograph the Earth rising over the moon. Now, the rest of us can see what it was like in a new NASA visualization that draws on richly detailed maps of the moon's surface made from data gathered by NASA's Lunar Reconnaissance Orbiter!
The narration in this visualization comes from the original audio recording of the Apollo 8 astronauts. The flight time has been compressed for effect. The Earth in this visualization is not an exact duplication of what the astronauts saw but a mosaic of more recent images taken by Earth-observing satellites. Representative clouds were then layered on top of the mosaic.

The first color Earthrise photograph taken by the Apollo 8 crew, rotated and scaled to match the simulation, with alpha channel. The second image is the clock overlay.
The black-and-white image taken by the Apollo 8 crew, rotated and scaled to match the simulation, with alpha channel. This was taken about a minute before the first color photo.
The raw frames, rendered at twice the frame rate of the other animations. Played at 30 FPS, these frames run at the actual speed of the Earthrise event. At 60 FPS, they match the running speed of the other animations.
A map showing which parts of the lunar terrain are visible in the photographs. Annotated with coordinate values, crater names, and coverage outlines.
Credits
Please give credit for this item to:
NASA/Goddard Space Flight Center
-
Animator
- Ernie Wright (USRA)
-
Video editor
- Chris Smith (HTSI)
-
Producer
- Chris Smith (HTSI)
-
Scientists
- Richard Vondrak (NASA/GSFC)
- James Rice (NASA/GSFC)
- Noah Petro (NASA/GSFC)
- Gordon Chin (NASA/GSFC)
- John Keller (NASA/GSFC)
Release date
This page was originally published on Thursday, April 19, 2012.
This page was last updated on Tuesday, November 14, 2023 at 12:18 AM EST.
Series
This visualization can be found in the following series:Tapes
This visualization originally appeared on the following tapes:-
Transit of Venus
(ID: 2012043)
Monday, June 4, 2012 at 4:00AM
Produced by - Robert Crippen (NASA)
Related
- ID: 10951
 Produced Video
Sources
- ID: 3936
 Visualization