NASA Spacecraft Track Solar Storms From Sun To Earth
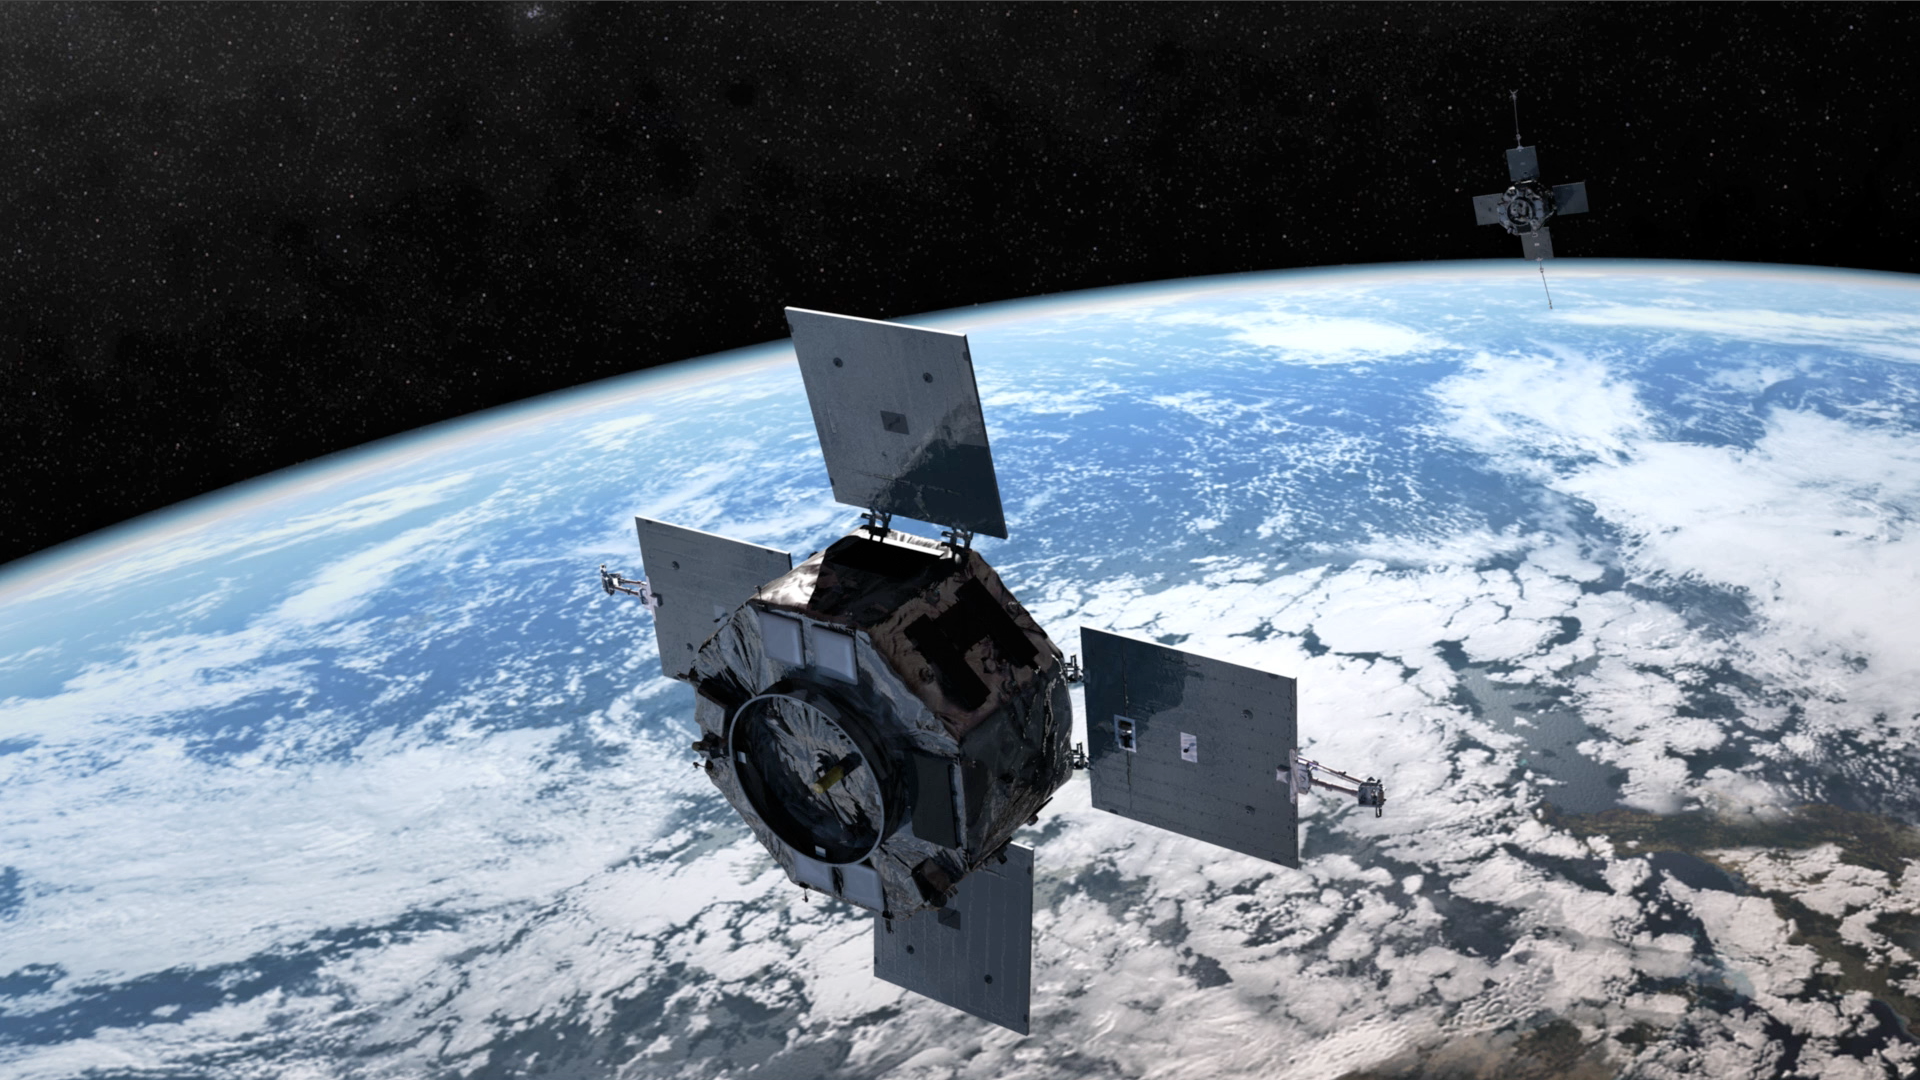
NASA's STEREO spacecraft and new data processing techniques have succeeded in tracking space weather events from their origin in the Sun's ultrahot corona to impact with the Earth 93 million miles away, resolving a 40-year mystery about the structure of the structures that cause space weather: how the structures that impact the Earth relate to the corresponding structures in the solar corona.
Despite many instruments that monitor the Sun and a fleet of near-earth probes, the connection between near-Earth disturbances and their counterparts on the Sun has been obscure, because CMEs and the solar wind evolve and change during the 93,000,000 mile journey from the Sun to the Earth.
STEREO includes "heliospheric imager" cameras that monitor the sky at large angles from the Sun, but the starfield and galaxy are 1,000 times brighter than the faint rays of sunlight reflected by free-floating electron clouds inside CMEs and the solar wind; this has made direct imaging of these important structures difficult or impossible, and limited understanding of the connection between space storms and the coronal structures that cause them.
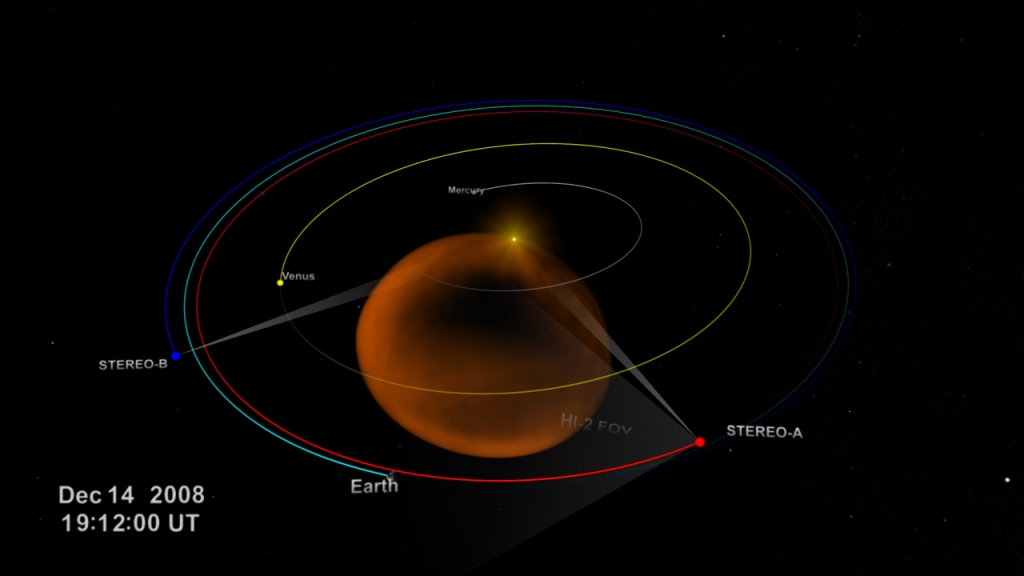
Newly released imagery reveals absolute brightness of detailed features in a large geoeffective CME in late 2008, connecting the original magnetized structure in the Sun's corona to the intricate anatomy of an interplanetary storm as it impacted the Earth three days later. At the time the data were collected, in late 2008, STEREO-A was nearly 45 degrees ahead of the Earth in its orbit, affording a very clear view of the Earth-Sun line.
For the press conference Visual 1, a visualization of the STEREO orbits and the 2008 CME, go here.
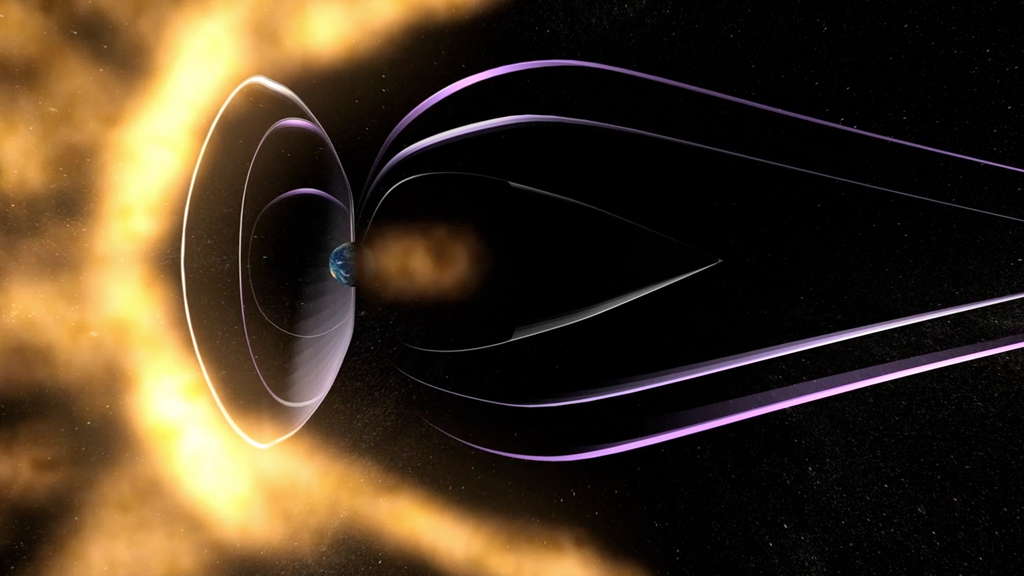
For Visual 7, a CME and reconnection animation, go here.
For Visual 8, footage of the October 2003 solar storms, go here.
Short, narrated video about the new ability to track space weather from the sun to the Earth.
For complete transcript, click here.
To track CMEs from the sun to Earth, STEREO uses five digital cameras, from a telescope pointed straight at the sun to a wide-field camera that sees Earth and Venus more than 45 degrees away. By distorting the many fields-of-view into radial coordinates, STEREO scientists can easily watch the CME's transit in a single video.
Credit: NASA/SwRI/STEREO
Newly reprocessed images from NASA's STEREO-A spacecraft, allow scientists to trace the anatomy of the December 2008 CME as it moves and changes on its journey from the Sun to the Earth, identify the origin and structure of the material that impacted Earth, and connect the image data directly with measurements at Earth at the time of impact. The gauge shows solar wind density measured by NASA's WIND spacecraft near Earth. When the piled up wall passes Earth, the wind gauge, from direct samples by the WIND spacecraft, pegs at 20 atoms per CC, then drops back to near zero. Wind density measurements agree closely with density estimates calculated from the brightness.
Credit: NASA/Goddard Space Flight Center/SwRI/STEREO/WIND
Newly reprocessed images from NASA's STEREO-A spacecraft allow scientists to trace the anatomy of the December 2008 CME as it moves and changes on its journey from the Sun to the Earth, identify the origin and structure of the material that impacted Earth, and connect the image data directly with measurements at Earth at the time of impact.
Credit: NASA/Goddard Space Flight Center/SwRI/STEREO
Simulation created by the Community Coordinated Modeling Center using the WSA-Enlil model of the solar wind. It shows an August 2011 CME and how it distorts the sun's magnetic field as it moves through it.
Credit: NASA/Goddard Space Flight Center/CCMC

Graphic showing launch dates of Heliophysics System Observatory missions plotted on a solar cycle timeline. Credit: NASA
Graphic depicting current and future Heliophysics System Observatory missions in their approximate regions of study. Credit: NASA
Additional Still.
Credit: NASA/Goddard Space Flight Center/SwRI/STEREO
Additional Still.
Credit: NASA/Goddard Space Flight Center/SwRI/STEREO
For More Information
Credits
Please give credit for this item to:
NASA/Goddard Space Flight Center. However, each element should be credited as indicated above.
-
Animators
- Tom Bridgman (Global Science and Technology, Inc.)
- Walt Feimer (HTSI)
- Scott Wiessinger (USRA)
- Craig DeForest (SwRI)
-
Video editors
- Scott Wiessinger (USRA)
- Swarupa Nune (Vantage)
-
Narrator
- Joycelyn Thomson Jones (NASA/GSFC)
-
Producers
- Scott Wiessinger (USRA)
- Swarupa Nune (Vantage)
-
Scientists
- Craig DeForest (SwRI)
- David Webb (Boston College)
-
Writers
- Scott Wiessinger (USRA)
- Craig DeForest (SwRI)
- Swarupa Nune (Vantage)
- Karen Fox (ADNET Systems, Inc.)
Release date
This page was originally published on Thursday, August 18, 2011.
This page was last updated on Tuesday, November 14, 2023 at 12:18 AM EST.
Series
This visualization can be found in the following series:Tapes
This visualization originally appeared on the following tapes:-
NASA Spacecraft Track Solar Storms From Sun To Earth
(ID: 2011088)
Thursday, August 18, 2011 at 4:00AM
Produced by - Robert Crippen (NASA)
Datasets used in this visualization
-
[STEREO]
ID: 169The STEREO mission consists of two Sun-observing spacecraft that will travel around the Sun on orbits slightly inside and slightly outside Earth's orbit.
This dataset can be found at: https://stereo.gsfc.nasa.gov
See all pages that use this dataset
Note: While we identify the data sets used in these visualizations, we do not store any further details, nor the data sets themselves on our site.
Related
- ID: 11027
 Produced Video
 - ID: 10821
 Produced Video
 - ID: 3847
 Visualization