NASA Mission Shows Evolution of Conditions at Edge of Solar System
New data from NASA's Interstellar Boundary Explorer, or IBEX, spacecraft, reveal that conditions at the edge of our solar system may be much more dynamic than previously thought. Future exploration missions will benefit in design and mission objectives from a better understanding of the changing conditions in this outer region of our solar system.
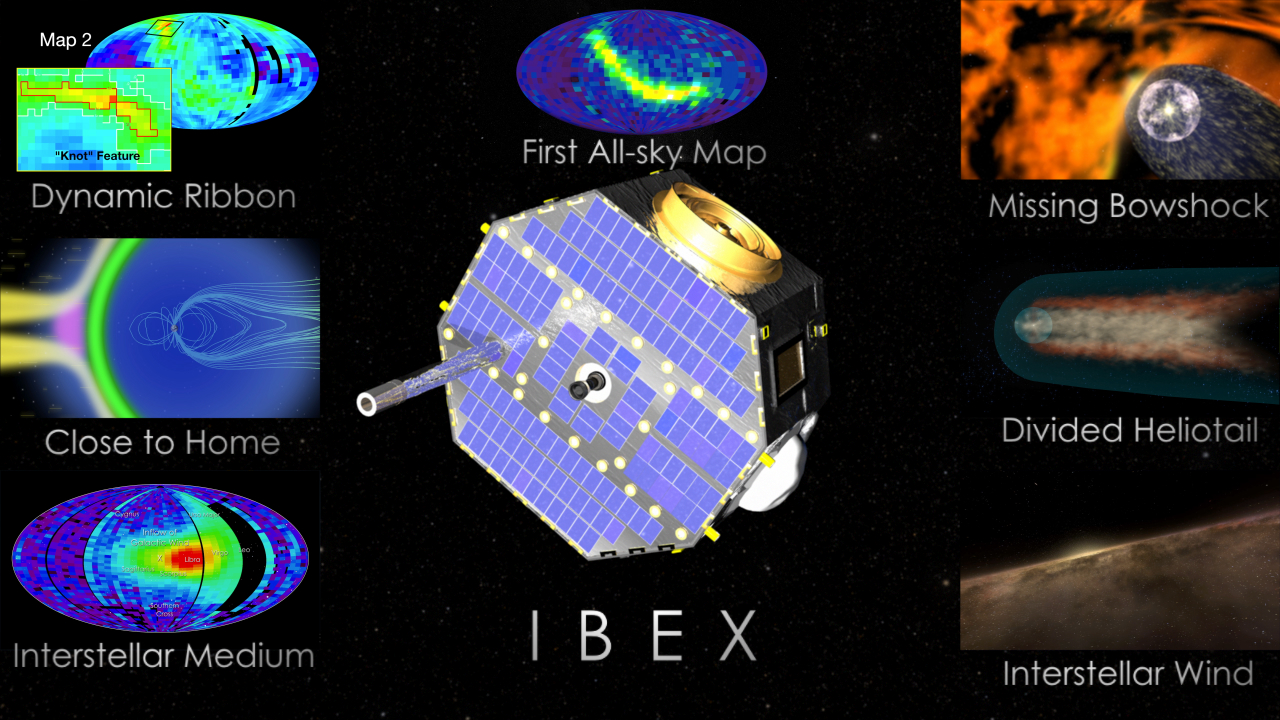
The IBEX has produced a new set of "all-sky" maps of our solar system's interaction with the galaxy, allowing researchers to continue viewing and studying the interaction between our galaxy and sun. The new maps reveal changing conditions in the region that separates the nearest reaches of our galaxy, called the local interstellar medium, from our heliosphere — a protective bubble that shields and protects our solar system.
In October 2009, scientists announced that the first map data produced by IBEX revealed an unpredicted bright ribbon of energetic neutral atoms emanating toward the sun from the edge of the solar system. This discovery was unexpected to scientists, because the ribbon of bright emissions did not resemble any previous theoretical models of the region.
The IBEX spacecraft creates sky maps by measuring and counting particles referred to as energetic neutral atoms that are created in an area of our solar system known as the interstellar boundary region. This imaging technique is required since this region emits no light that can be collected by conventional telescopes. This interstellar boundary is where charged particles from the sun, called the solar wind, flow outward far beyond the orbits of the planets and collide with material between stars. These collisions cause energetic neutral atoms to travel inward toward the sun from interstellar space at velocities ranging from 100,000 mph to more than 2.4 million mph.
This second set of all-sky maps, created using data collected during six months of observations, show the evolution of the interstellar boundary region. The maps help delineate the interstellar boundary region, the area at the edge of our solar system that shields it from most of the dangerous galactic cosmic radiation that would otherwise enter from interstellar space. The new findings were published this week in the Journal of Geophysical Research - Space Physics, a publication of the American Geophysical Union.
The IBEX science team compares the first and second maps to reveal whether there are time variations in the Ribbon or the more distributed emissions around the ribbon. This animation fades between the first and second IBEX maps. We see that the first and second maps are relatively similar. However, there are significant time variations as well. These time variations are forcing scientists to try to understand how the heliosphere can be changing so rapidly.

One of the clear features visible in the IBEX maps is an apparent knot in the ribbon. Scientists were anxious to see how this structure would change with time. The second map showed that the knot in the ribbon somehow spread out. It is as if the knot in the ribbon was literally untangled over only 6 months. First map.
One of the clear features visible in the IBEX maps is an apparent knot in the ribbon. Scientists were anxious to see how this structure would change with time. The second map showed that the knot in the ribbon somehow spread out. It is as if the knot in the ribbon was literally untangled over only 6 months. Second map.
Enlargement of the "knot" feature at the 2.73KeV energy level. Map 1.
Enlargement of the "knot" feature at the 2.73KeV energy level. Map 2.
.71Kev Map 1.
.71Kev Map 2.
1.11Kev Map 1.
1.11Kev Map 2.
1.74Kev Map 1.
1.74Kev Map 2.
2.73Kev Map 1.
2.73Kev Map 2.
4.29KeV Map 1.
4.29KeV Map 2.
For More Information
Credits
Please give credit for this item to:
IBEX Science Team/NASA/Goddard Space Flight Center
-
Video editor
- Scott Wiessinger (UMBC)
-
Producer
- Scott Wiessinger (UMBC)
-
Scientists
- Dave McComas (SwRI)
- Nathan Schwadron (University of New Hampshire)
Release date
This page was originally published on Thursday, September 30, 2010.
This page was last updated on Wednesday, May 3, 2023 at 1:54 PM EDT.
Missions
This visualization is related to the following missions:Series
This visualization can be found in the following series:Tapes
This visualization originally appeared on the following tapes:-
IBEX Media Telecon Sept 2010
(ID: 2010117)
Monday, September 20, 2010 at 4:00AM
Produced by - Robert Crippen (NASA)
Datasets used in this visualization
-
Differential Flux (0.9-1.5 keV) [IBEX: IBEX-Hi]
ID: 660
Note: While we identify the data sets used in these visualizations, we do not store any further details, nor the data sets themselves on our site.
Related
- ID: 13642
![Watch this video on the NASA Goddard YouTube channel.Music credits: “End of Days - Joe Mason Remix” by Connor Shambrook [BMI], Cyrus Reynolds [BMI], Flynn Hase Spence [ASCAP], Joseph Scott Mason [APRA]; “Brainstorming” by Laurent Dury [SACEM]; “Flight of the Leaf Remix” by Julie Gruss [GEMA], Laurent Dury [SAXEM]; “Ticks and Thoughts” by Laurent Dury [SACEM]; “Intimate Journey” by Laurent Vernerey [SACEM], Nicolas de Ferran [SACEM] from Universal Production MusicComplete transcript available.](/vis/a010000/a013600/a013642/13642_IBEX11years_YouTube.00214_print.jpg) Produced Video
Produced Video - ID: 11382
 Produced Video
 - ID: 10908
 Produced Video