Fermi All-Sky First Year Progress
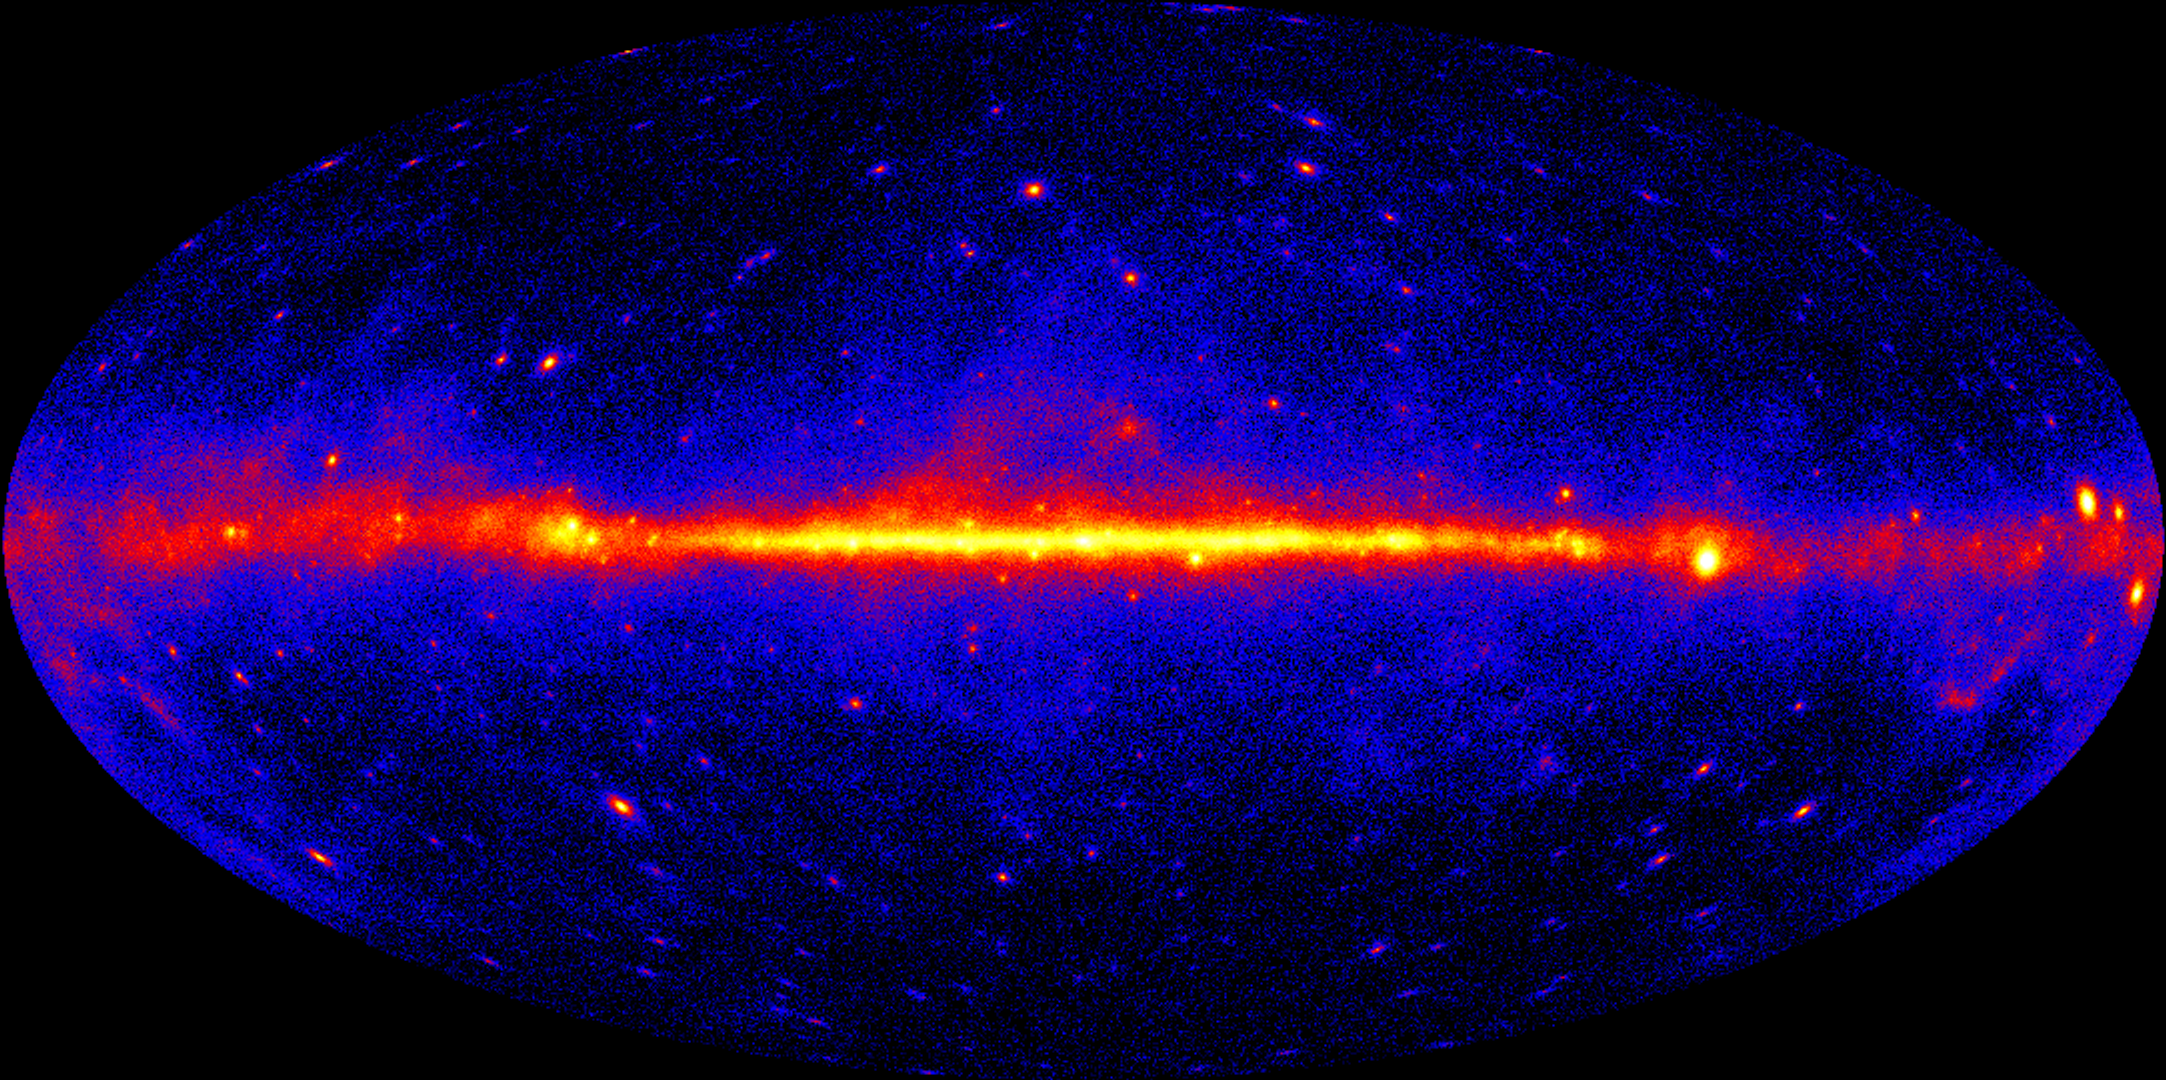
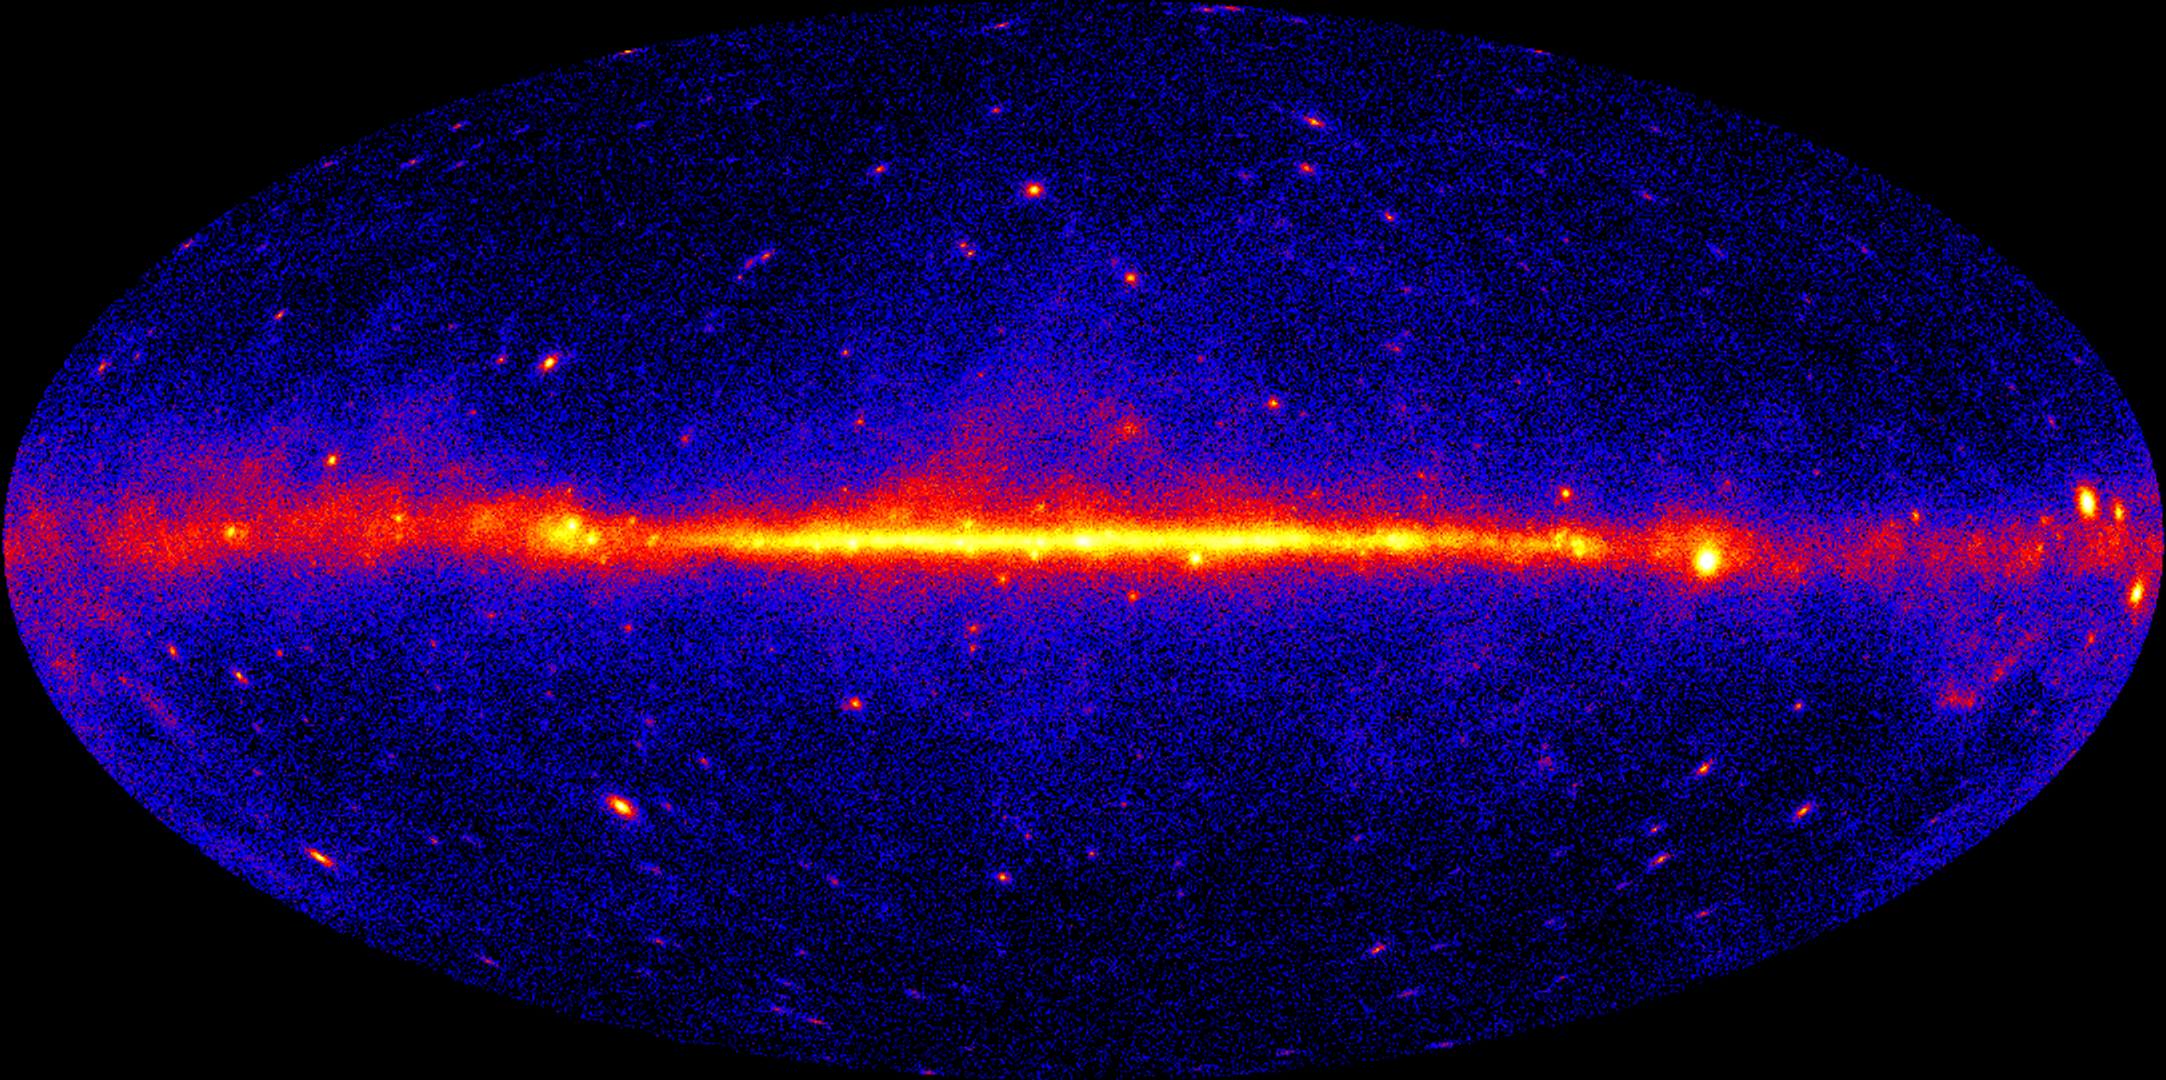
This view of the gamma-ray sky constructed from one year of Fermi LAT observations is the best view of the extreme universe to date. The map shows the rate at which the LAT detects gamma rays with energies above 300 million electron volts — about 120 million times the energy of visible light — from different sky directions. Brighter colors equal higher rates.
Sequence of dissolves showing the improvement in the Fermi all-sky map, from 1 week to 1 year.
Alternate sequence of dissolves showing the improvement in the Fermi all-sky map, from 1 week to 1 year.
Split-screen dissolve showing the improvement between the 1-week all-sky map and the 1-year map.
Alternate split-screen dissolve showing the improvement between the 1-week all-sky map and the 1-year map.

Still of Fermi 1-year all-sky map.
Alternate high resolution still of 1-year all-sky map.
Still of Fermi 6-month all-sky map.
Alternate high resolution still of 6-month all-sky map.
Still of 3-month all-sky map.
Alternate high resolution still of 3-month all-sky map.
High resolution still of Fermi 1-month all-sky map.
High resolution still of Fermi 1-week all-sky map.
Credits
Please give credit for this item to:
NASA/DOE/Fermi LAT Collaboration
-
Animator
- Jean Ballet (CEA Saclay)
-
Video editor
- Scott Wiessinger (UMBC)
-
Producers
- Scott Wiessinger (UMBC)
- Stefanie Misztal (UMBC)
-
Scientist
- Julie McEnery (NASA/GSFC)
-
Writer
- Francis Reddy (SPSYS)
Release date
This page was originally published on Wednesday, October 28, 2009.
This page was last updated on Wednesday, May 3, 2023 at 1:54 PM EDT.
Missions
This visualization is related to the following missions:Series
This visualization can be found in the following series:Datasets used in this visualization
-
[Fermi: LAT]
ID: 216Fermi Gamma-ray Large Area Space Telescope (GLAST) Large Area Telescope (LAT)
This dataset can be found at: http://fermi.gsfc.nasa.gov
See all pages that use this dataset -
[Fermi]
ID: 687
Note: While we identify the data sets used in these visualizations, we do not store any further details, nor the data sets themselves on our site.
Related
- ID: 14090
 Produced Video
 - ID: 11342
 Produced Video