Sun
ID: 4318
The Interface Region Imaging Spectrograph (IRIS) explorer is one of the latest imaging spectrographs developed for NASA missions, this one designed for exploring the energization process in the solar chromosphere at higher resolution than previously possible.
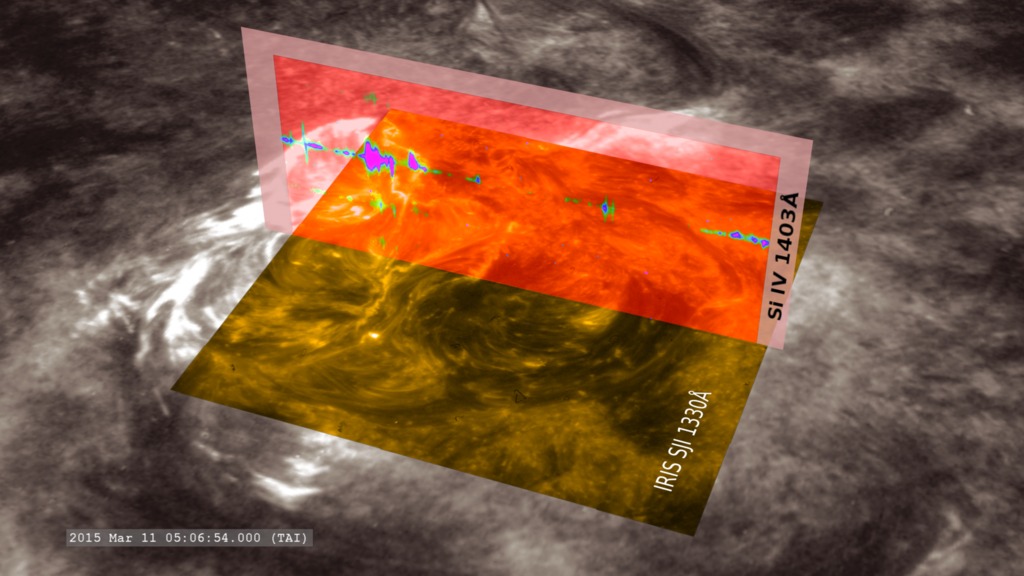
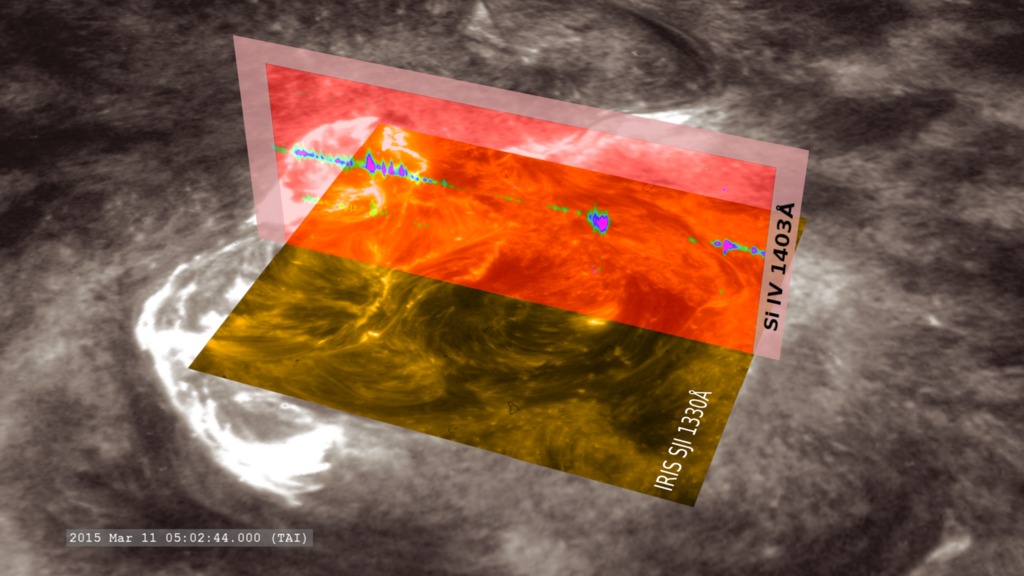
An imaging spectrograph not only takes an image of the region of interest, but also has a small slit in the imager (seen as a dark line about half-way across the image) which passes a thin ribbon of light to a spectroscope. The spectroscope spreads the light out in its component frequencies or spectrum. Monitoring of specfic spectral lines provides additional information on the velocity (and therefore temperature) of plasma in the observed region.
In the visualization presented here, the IRIS slit-jaw imager (SJI) takes images with two different filters, one at 1330 angstroms (gold color table), the other at 1400 angstroms (bronze color table), and these images are displayed overlaying corresponding imagery from the Solar Dynamics Observatory (SDO) 304 angstrom filter (grayscale). The spectra, in this case a closeup view on the 1403 angstrom line from 3-times ionized silicon (designated Si IV), is presented on a semi-transparent plane perpendicular to the images, at the position of the slit in the imager. This allows us to see correlations between features in the images and spectra. For example, some of the bright spots in the image correlate to wider regions along the line suggesting higher temperatures and/or velocities of the plasma emitting the spectral line.
To better examine the region, the instrument also scans the slit over the region of interest, collecting multiple spectra. This allows scientists to compare and correlate structures seen in images with speeds and temperatures of the plasma.
Imaging spectrographs have been flown on other NASA missions, such as the STIS instrument on the Hubble space telescope.
A Slice of Light: How IRIS Observes the Sun
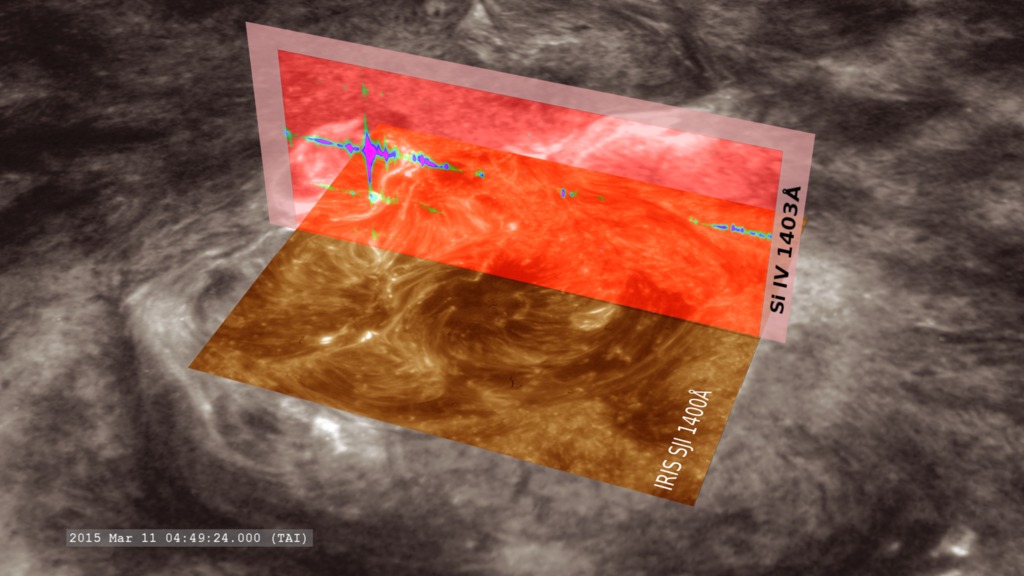
An imaging spectrograph not only takes an image of the region of interest, but also has a small slit in the imager (seen as a dark line about half-way across the image) which passes a thin ribbon of light to a spectroscope. The spectroscope spreads the light out in its component frequencies or spectrum. Monitoring of specfic spectral lines provides additional information on the velocity (and therefore temperature) of plasma in the observed region.
In the visualization presented here, the IRIS slit-jaw imager (SJI) takes images with two different filters, one at 1330 angstroms (gold color table), the other at 1400 angstroms (bronze color table), and these images are displayed overlaying corresponding imagery from the Solar Dynamics Observatory (SDO) 304 angstrom filter (grayscale). The spectra, in this case a closeup view on the 1403 angstrom line from 3-times ionized silicon (designated Si IV), is presented on a semi-transparent plane perpendicular to the images, at the position of the slit in the imager. This allows us to see correlations between features in the images and spectra. For example, some of the bright spots in the image correlate to wider regions along the line suggesting higher temperatures and/or velocities of the plasma emitting the spectral line.
To better examine the region, the instrument also scans the slit over the region of interest, collecting multiple spectra. This allows scientists to compare and correlate structures seen in images with speeds and temperatures of the plasma.
Imaging spectrographs have been flown on other NASA missions, such as the STIS instrument on the Hubble space telescope.
Related
Visualization Credits
Tom Bridgman (Global Science and Technology, Inc.): Lead Visualizer
Bart De Pontieu (Lockheed Martin Solar and Astrophysics Lab): Lead Scientist
Adrian Daw (NASA/GSFC): Scientist
Genna Duberstein (USRA): Lead Producer
Karen Fox (ADNET Systems, Inc.): Lead Writer
Bart De Pontieu (Lockheed Martin Solar and Astrophysics Lab): Lead Scientist
Adrian Daw (NASA/GSFC): Scientist
Genna Duberstein (USRA): Lead Producer
Karen Fox (ADNET Systems, Inc.): Lead Writer
Please give credit for this item to:
NASA's Scientific Visualization Studio
NASA's Scientific Visualization Studio
Short URL to share this page:
https://svs.gsfc.nasa.gov/4318
Missions:
IRIS: Interface Region Imaging Spectrograph
SDO
Data Used:
Note: While we identify the data sets used in these visualizations, we do not store any further details nor the data sets themselves on our site.
Keywords:
SVS >> Hyperspectral
SVS >> Hyperwall
SVS >> SDO
SVS >> Solar Dynamics Observatory
SVS >> Spectroscopy
NASA Science >> Sun
SVS >> IRIS Mission
SVS >> Extreme Ultraviolet Imaging
SVS >> EUV Imaging
https://svs.gsfc.nasa.gov/4318
Missions:
IRIS: Interface Region Imaging Spectrograph
SDO
Data Used:
SDO/AIA/304 Filter also referred to as: AIA 304
JOINT SCIENCE OPERATIONS CENTERIRIS/Imager/SJI also referred to as: Slit-Jaw Imager
Observed Data - LMSALKeywords:
SVS >> Hyperspectral
SVS >> Hyperwall
SVS >> SDO
SVS >> Solar Dynamics Observatory
SVS >> Spectroscopy
NASA Science >> Sun
SVS >> IRIS Mission
SVS >> Extreme Ultraviolet Imaging
SVS >> EUV Imaging


