Bennu TAG Surface Change
This visualization begins with a top-down view of a high resolution digital terrain model (DTM) of the Nightingale TAG sample site on Bennu. As the camera moves closer, data representing the surface height change pre-post TAG fades on. The surface height change as a result of the TAG event is represented by both a color map and by offsetting the original DTM to reveal the TAG crater. The DTM offset is applied to the surface region within ~7.5 meters of impact, which is highlighted for emphasis. With this color bar, yellows, greens, and blues represent a decrease in elevation, light red represents no change in elevation, and dark red represents an increase in elevation. Thruster marks and a region of ejected surface material are labeled. The camera does a 360 degree spin around the sample site before returning to a top-down view of the color-mapped data.
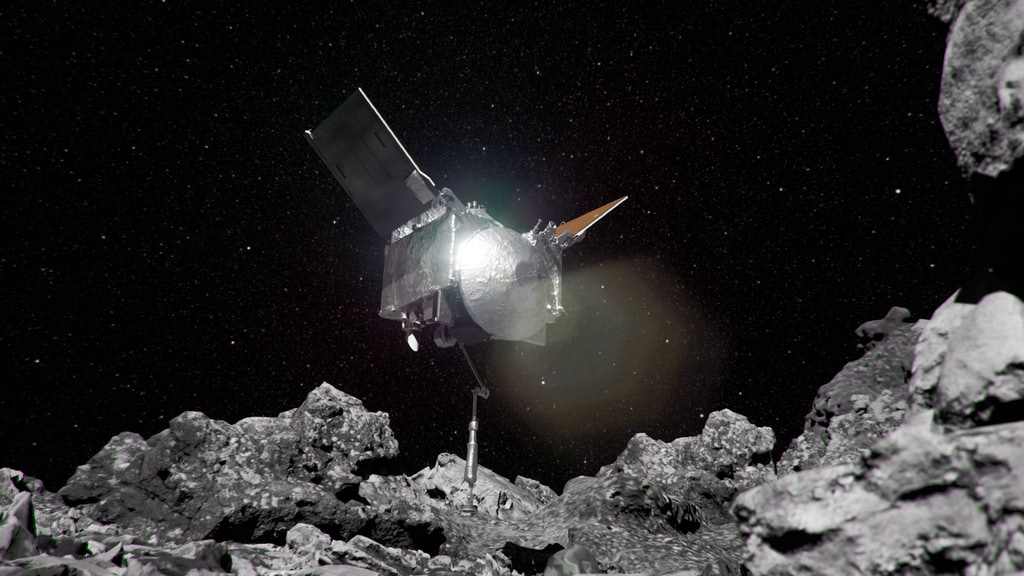
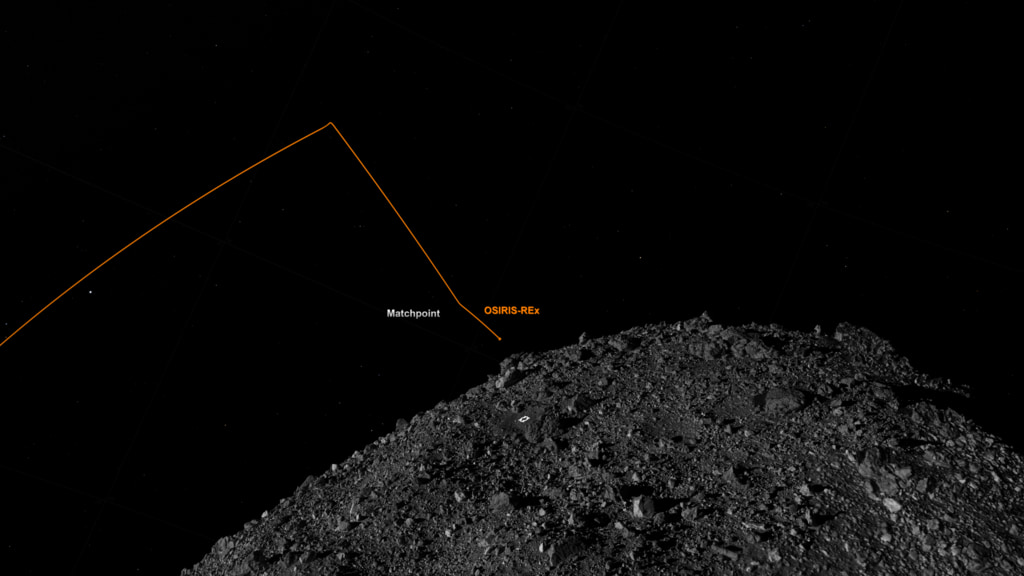
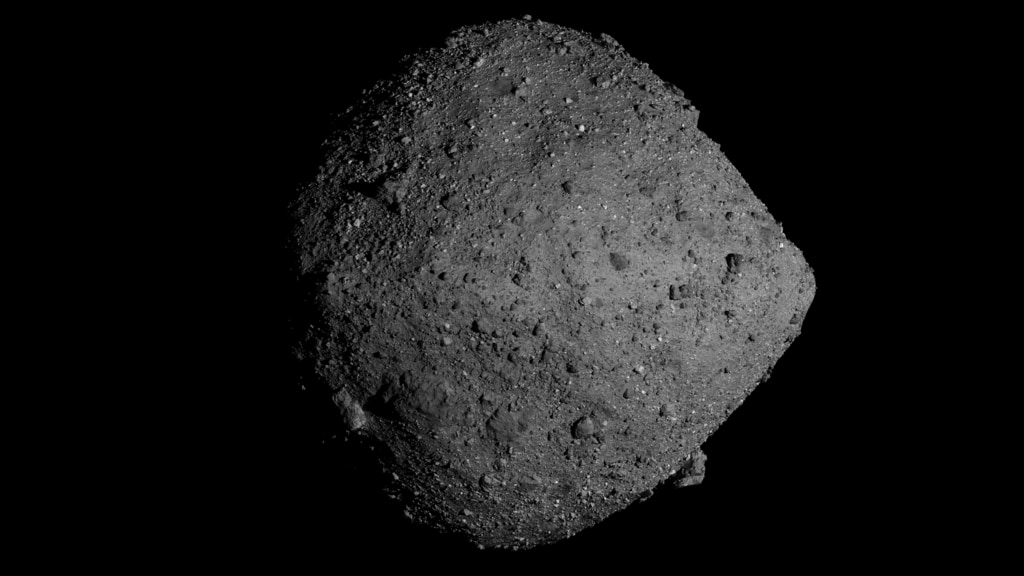
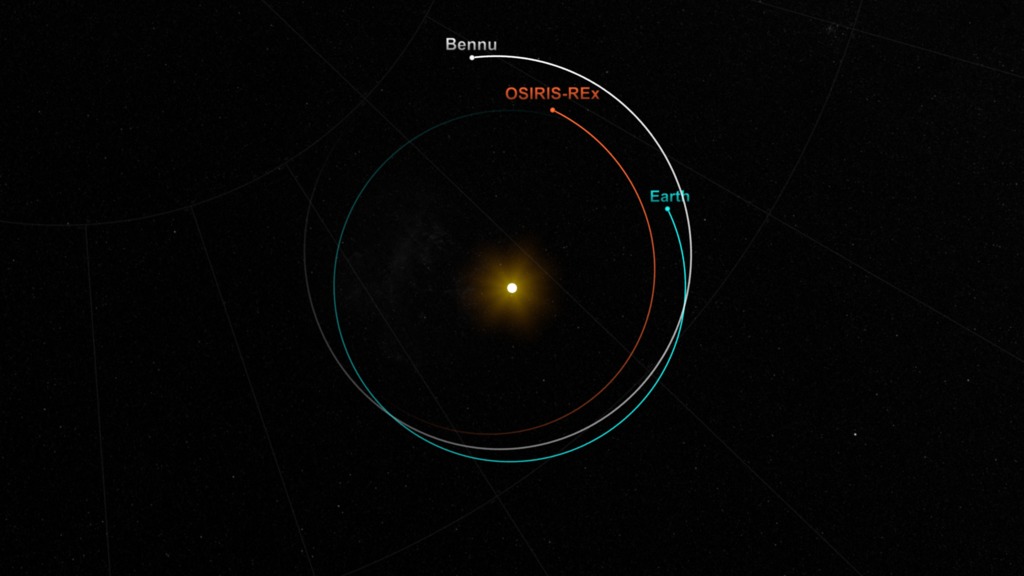
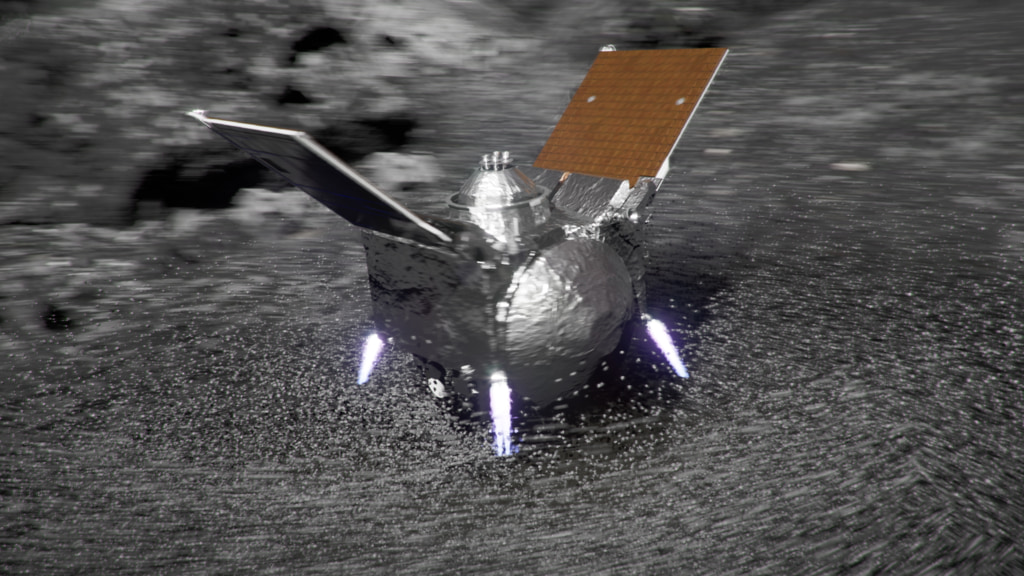
The Origins Spectral Interpretation Resource Identification Security-Regolith Explorer (OSIRIS-REx) spacecraft arrived at near-Earth asteroid Bennu in December 2018. After studying the asteroid for nearly two years, the spacecraft successfully performed a Touch-And-Go (TAG) sample collection maneuver on October 20, 2020. The change in surface topography as a result of the sample collection maneuver is observed by comparing pre-TAG and post-TAG digital terrain models (DTM), revealing the newly-formed TAG crater.
OSIRIS-REx will return its sample of Bennu to Earth in September 2023.
Same visualization as above, but without “Point of Impact,” "Ejected Material," and “Thruster Mark” labels

Still image - Top-down view of a high resolution digital terrain model (DTM) of the Nightingale TAG sample site on Bennu.
Still image - Oblique view of the Nightingale TAG sample site with the TAG impact location labeled.
Still image - Oblique view of the TAG sample site with pre-post surface height change data represented by both a color map and by offsetting the original DTM to reveal the TAG crater. The DTM offset is only applied to the surface region within ~7.5 meters of impact, which is highlighted for emphasis.
Still image - Oblique view of the TAG sample site with pre-post surface height change data represented by both a color map and by offsetting the original DTM to reveal the TAG crater. The DTM offset is only applied to the surface region within ~7.5 meters of impact, which is highlighted for emphasis. Additional surface features resulting from TAG are labeled.
Still image - Top-down view of a high resolution digital terrain model (DTM) of the Nightingale TAG sample site on Bennu with pre-post surface height change data.
Credits
Please give credit for this item to:
NASA's Scientific Visualization Studio
Data provided by NASA/University of Arizona/CSA/York University/Open University/MDA.
-
Visualizer
- Kel Elkins (USRA)
-
Producer
- Dan Gallagher (KBR Wyle Services, LLC)
-
Principal investigator
- Dante Lauretta (The University of Arizona)
-
Scientist
- Olivier Barnouin (JHUAPL)
Release date
This page was originally published on Thursday, July 7, 2022.
This page was last updated on Sunday, April 7, 2024 at 12:16 AM EDT.
Datasets used in this visualization
-
LIDAR [OSIRIS-REx: OLA]
ID: 1055The OSIRIS-REx Laser Altimeter (OLA) is a scanning LIDAR (Light Detection and Ranging). LIDAR is similar to RADAR, but it uses light instead of radio waves to measure distance. OLA emitted laser pulses at the surface of Bennu, which reflected back from the surface and returned a portion of the laser pulse to the LIDAR detector. By carefully measuring the time difference between the outgoing pulse and the incoming pulse, the distance from the spacecraft to the surface of Bennu was computed using the speed of light. This allowed OLA to provide high-resolution topographical information about Bennu during the mission.
See all pages that use this dataset -
Imagery [OSIRIS-REx: OCAMS]
ID: 1063The OSIRIS-REx Camera Suite (OCAMS) consists of three cameras: PolyCam, MapCam, and SamCam. These cameras captured a wealth of imagery during OSIRIS-REx’s time at asteroid Bennu. To help mission planners select a site on Bennu for sample collection, OCAMS provided global image mapping of the asteroid’s surface and more detailed images of potential sample sites. OCAMS also recorded the sampling event during the touch-and-go (TAG) maneuver.
Credit: NASA/University of Arizona/CSA/York University/MDA
See all pages that use this dataset
Note: While we identify the data sets used in these visualizations, we do not store any further details, nor the data sets themselves on our site.
Related
- ID: 20362
- ID: 20360
- ID: 4905
- ID: 4862
 Visualization
 - ID: 4863
 Visualization
 - ID: 4857
- ID: 4482
Used as a Source In
- ID: 14179
 Produced Video