A Solar Cycle from Solar Dynamics Observatory
4K x 4K imagery from the SDO/HMI instrument.
This visualization is a series of graphic components to present nearly a full sunspot cycle observed by Solar Dynamics Observatory.
Animated plots of sunspot numbers (26 day smoothed average) with and without axes.
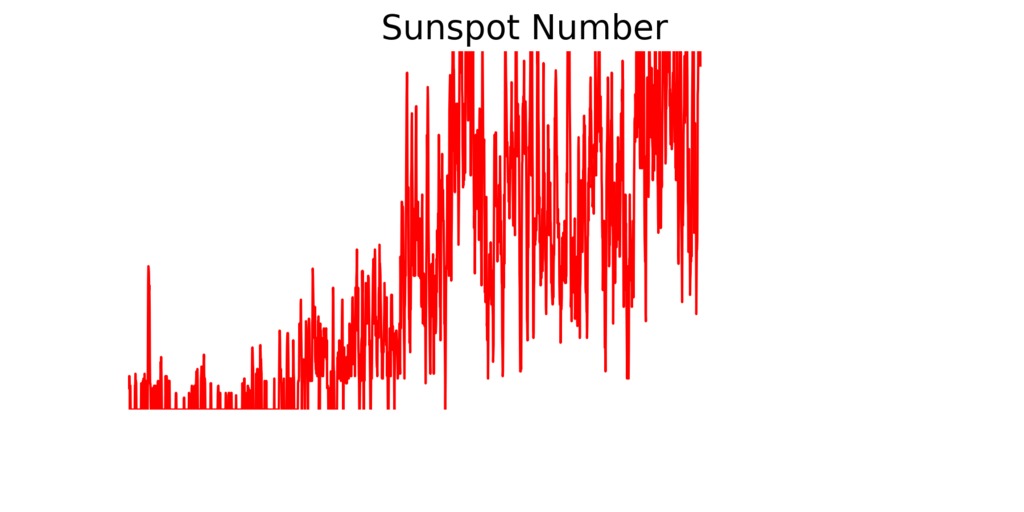
Animated plots of sunspot numbers (no averaging or smoothing). Generated as overlay to co-register on extra sunspot graphic.
Credits
Please give credit for this item to:
NASA's Scientific Visualization Studio
Visualizer
- Tom Bridgman (Global Science and Technology, Inc.)
Producers
- Scott Wiessinger (USRA)
- Genna Duberstein (USRA)
Technical support
- Laurence Schuler (ADNET Systems, Inc.)
- Ian Jones (ADNET Systems, Inc.)
Release date
This page was originally published on Saturday, February 11, 2017.
This page was last updated on Wednesday, May 3, 2023 at 1:47 PM EDT.
Missions
This visualization is related to the following missions:Datasets used in this visualization
Sun Spot Number
ID: 566This dataset can be found at: http://sidc.oma.be/sunspot-data/
See all pages that use this datasetSDO Continuum (Continuum) [SDO: HMI]
ID: 674
Note: While we identify the data sets used in these visualizations, we do not store any further details, nor the data sets themselves on our site.
Used as a Source In
- ID: 12500
 Produced Video