Vegetation Greening Trend in Canada and Alaska: 1984-2012
This animation examines the change in the vegetation trend over Canada and Alaska between 1984 and 2012.
High-latitude regions have been warming rapidly since the last century, at a rate higher than the global average. At continental scales, satellite data since the 1980s have indicated increased vegetation productivity (greening) across northern high latitudes, and a productivity decline (browning) for certain areas of undisturbed boreal forest of Canada and Alaska. These remote sensing results have been corroborated by in-situ evidence.
This research provides a spatially complete view of the vegetation greenness change for all of Canada and Alaska by calculating per-pixel NDVI trend from all available 1984–2012 peak-summer Landsat-5 and -7 surface reflectance data. By incorporating observations from overlapping scenes, researchers obtained up to 160 valid NDVI values for certain areas from this 29-year period, establishing the mid-Summer greenness trend.
This animation shows the resulting greenness trend over Canada and Alaska with special attention focused on the regions of Quebec and northern Alaska.

The colorbar applied to the vegetation productivity trend data. Green colors indicate an increase while brown colors indicate a decrease.
A print resolution image of the greening trend over Quebec, Canada.
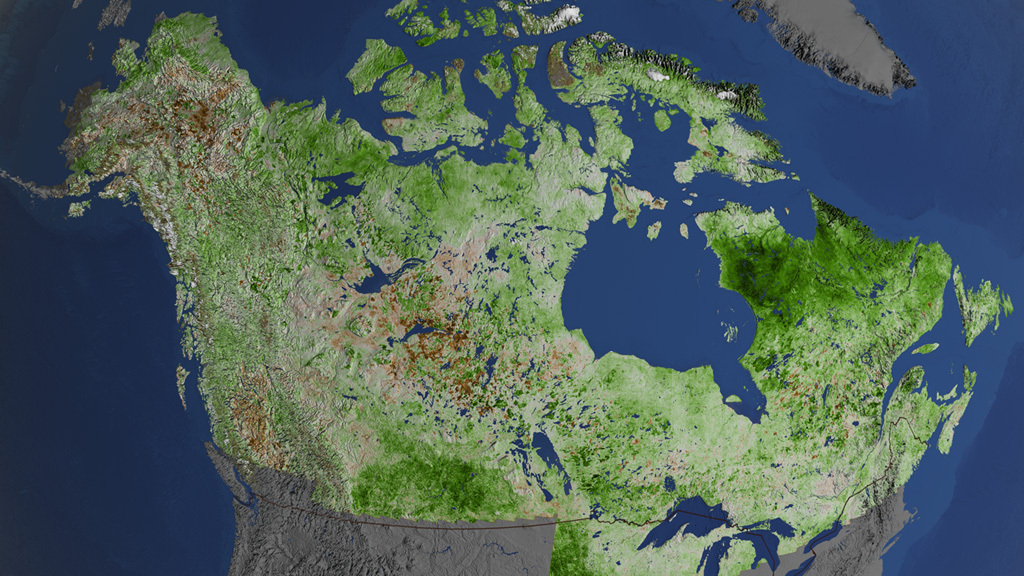
A print resolution image of the greening trend over Canada and Alaska.
Credits
Please give credit for this item to:
NASA's Scientific Visualization Studio
-
Visualizer
- Cindy Starr (Global Science and Technology, Inc.)
-
Scientists
- Junchang Ju (USRA)
- Jeffrey Masek (NASA/GSFC)
-
Producer
- Matthew R. Radcliff (USRA)
-
Data provider
- Eric Sokolowsky (Global Science and Technology, Inc.)
-
Project support
- Joycelyn Thomson Jones (NASA/GSFC)
- Leann Johnson (Global Science and Technology, Inc.)
-
Technical support
- Laurence Schuler (ADNET Systems, Inc.)
- Ian Jones (ADNET Systems, Inc.)
Release date
This page was originally published on Thursday, June 2, 2016.
This page was last updated on Tuesday, November 14, 2023 at 12:07 AM EST.
Missions
This visualization is related to the following missions:Papers used in this visualization
Datasets used in this visualization
-
Landsat NDVI Trend (1984–2012) [Landsat]
ID: 934This research used a nominal peak greenness period, July 1 to August 31, to accommodate tundra of all regions for Landsat data selection. We only considered the terrain-corrected scenes, excluding scenes that have cloud cover more than 80%. As a result, a total of 87,762 Landsat scenes over 1271 Path/Row locations were selected from 1984-2012. Of these, 63% were from Landsat-5, as Landsat-5 provided the only data source for 1984-1998 and continued to acquire data until 2011. This work aims to provide a spatially complete view of the vegetation greenness change for all of Canada and Alaska by calculating per-pixel NDVI trend from all available 1984-2012 peak-summer Landsat-5 and -7 surface reflectance data.
See all pages that use this dataset
Note: While we identify the data sets used in these visualizations, we do not store any further details, nor the data sets themselves on our site.
Used as a Source In
- ID: 13781
![Music: A Curious Incident by Jay Price [PRS] and Paul Reeves [PRS]Complete transcript available.](/vis/a010000/a013700/a013781/CO20.jpg)
- ID: 12276
 Produced Video
 - ID: 12225
![NASA scientists used almost 30 years of data from the NASA/USGS Landsat satellites to track changes in vegetation in Alaska and Canada. Of the more than 4 million square miles, 30% had increases in vegetation (greening) while only 3% had decreases (browning). This is the first study to produce a continent-scale map while still providing detailed information at the human scale.Music: "Alaska," by Janik Riegert [GEMA], Josh Tapen [GEMA]Watch this video on the NASA Goddard YouTube channel.](/vis/a010000/a012200/a012225/12225_Arctic_greening_MASTER_large.00140_print.jpg) Produced Video
Produced Video