KORUS_AQ: Total Tropospheric Ozone levels over the Korean Peninsula in June 2013
These visuals were created in anticipation of the 2016 Korean United States Air Quality study (KORUS-AQ) field campaign which will combine observations from aircraft, satellties, ships and ground stations with air quality models to assess and monitor air quality acorss urban, rural and coastal areas.
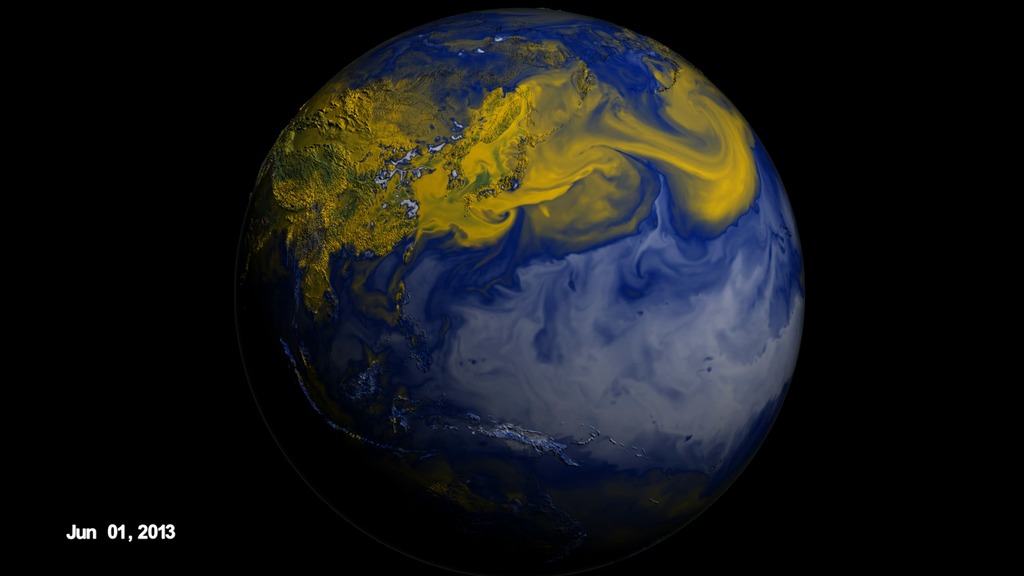
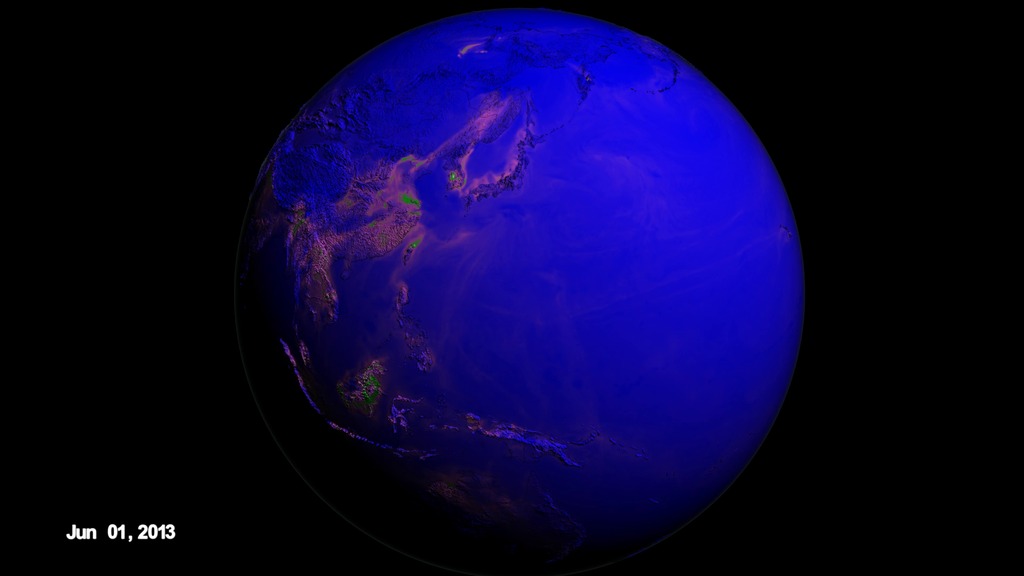
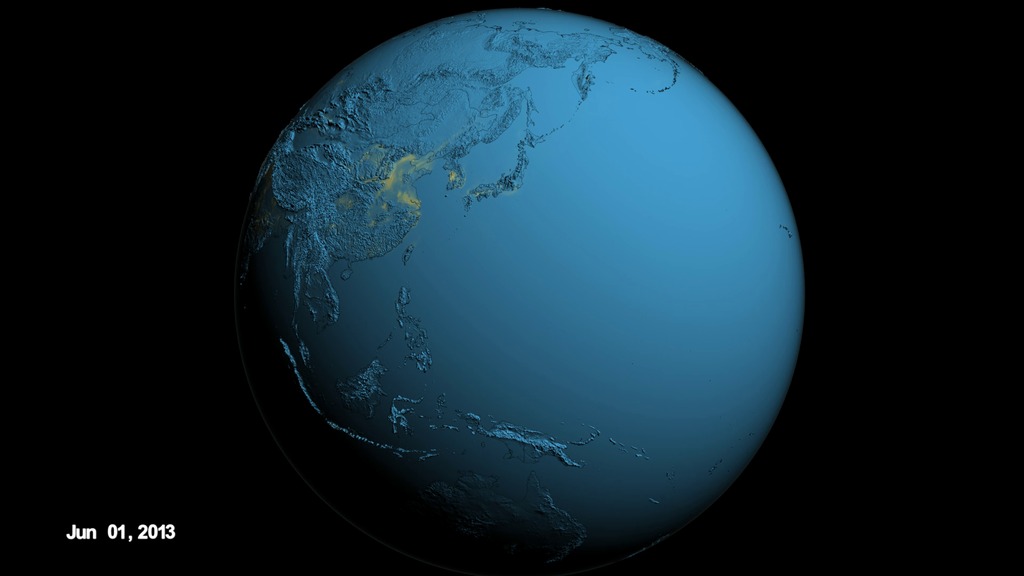
These visuals are showing the total tropospheric ozone levels over the Korean peninsula in June 2013 according to the GEOS-5 Nature Run chemistry model data.
Total Tropospheric Ozone over the Korean peninsula in June 2013.

Total tropospheric ozone levels over the Korean peninsula. There are three images here. The first two are closeups of the Korean peninsula on June 1, 2013 and June 12, 2013. The third is a view of Asia and the North Pacific on June 2, 2013.
The color bar for total tropospheric ozone.
For More Information
See NASA.gov
Credits
Please give credit for this item to:
NASA's Scientific Visualization Studio
-
Visualizer
- Cheng Zhang (USRA)
-
Technical support
- Laurence Schuler (ADNET Systems, Inc.)
- Ian Jones (ADNET Systems, Inc.)
-
Animator
- Greg Shirah (NASA/GSFC)
-
Producer
- Jefferson Beck (USRA)
-
Writer
- Samson K. Reiny (Wyle Information Systems)
Release date
This page was originally published on Monday, May 9, 2016.
This page was last updated on Tuesday, November 14, 2023 at 12:07 AM EST.
Datasets used in this visualization
-
G5NR-Chem (Chemistry) [GEOS-5: Nature Run]
ID: 946
Note: While we identify the data sets used in these visualizations, we do not store any further details, nor the data sets themselves on our site.
Related
- ID: 4448
- ID: 4449
- ID: 4447