NASA-USDA-FAS Soil Moisture / IMERG
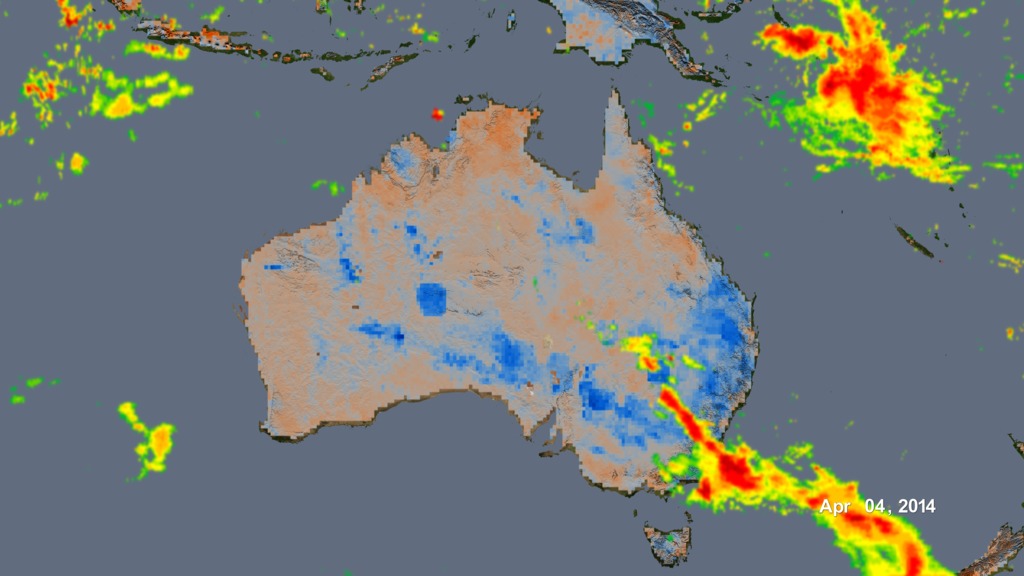
Soil Moisture / Precipitation in Australia, Absolute
This visualization shows the correlation and lag time of surface soil moisture following precipitation events over Australia, India, and the United States. It uses the new NASA-USDA-FAS Soil Moisture product, a joint effort of NASA and the USDA Foreign Agricultural Service, and the global Integrated Multi-satellitE Retrievals for GPM (IMERG) precipitation dataset, which provides rainfall rates for the entire world every thirty minutes. This animation shows the 30-minute rainfall product, while the soil moisture data is a three-day moving average. Anomaly data is expressed as a standardized anomaly, e.g. (value-average)/stdev, and as such is unitless.
For more detailed information about the soil moisture product:
http://www.pecad.fas.usda.gov/cropexplorer/description.aspx?legendid=355
Bolten, J. D., W. T. Crow, T. J. Jackson, X. Zhan, and C. A. Reynolds (2010), Evaluating the utility of remotely-sensed soil moisture retrievals for operational agricultural drought monitoring, IEEE J. Sel. Topics Appl. Earth Obs., 3(1), 57–66.
Soil Moisture / Precipitation in Australia, Absolute, with Colorbar
Soil Moisture / Precipitation in Australia, Anomaly
Soil Moisture / Precipitation in Australia, Anomaly with Colorbar
Soil Moisture / Precipitation in Australia, Anomaly, Hyperwall Resolution
Soil Moisture / Precipitation in India, Absolute
Soil Moisture / Precipitation in India, Absolute with Colorbar
Soil Moisture / Precipitation in India, Anomaly
Soil Moisture / Precipitation in India, Anomaly with Colorbar
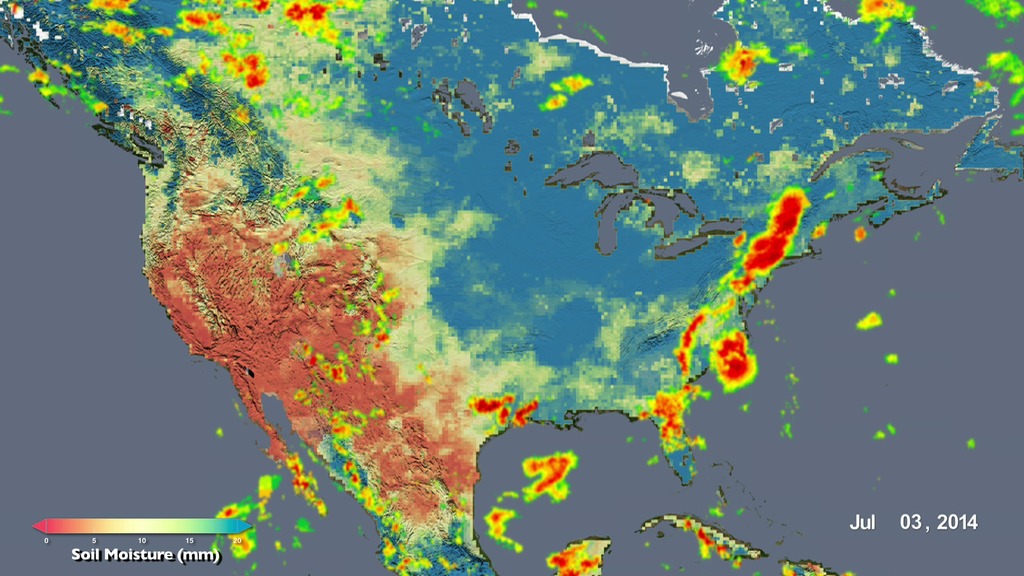
Soil Moisture / Precipitation in United States, Absolute
Soil Moisture / Precipitation in United States, Absolute with Colorbar
Soil Moisture / Precipitation in United States, Anomaly
Soil Moisture / Precipitation in United States, Anomaly with Colorbar

Colorbar, Soil Moisture, Absolute
Colorbar, Soil Moisture, Anomaly
Colorbar, IMERG
Soil Moisture / Precipitation in Peru, Absolute
Soil Moisture / Precipitation in Peru, Absolute with Colorbar
Soil Moisture / Precipitation in Peru, Anomaly
Soil Moisture / Precipitation in Peru, Anomaly with Colorbar
Soil Moisture / Precipitation over the entire globe, Anomaly with Colorbar
For More Information
Credits
Please give credit for this item to:
NASA's Scientific Visualization Studio
-
Visualizers
- Trent L. Schindler (USRA)
- Horace Mitchell (NASA/GSFC)
-
Scientists
- John D. Bolten (NASA/GSFC)
- Iliana E. Mladenova (University of Maryland)
- Dalia B Kirschbaum (NASA/GSFC)
-
Producer
- Matthew R. Radcliff (USRA)
Release date
This page was originally published on Wednesday, March 30, 2016.
This page was last updated on Sunday, March 24, 2024 at 12:06 AM EDT.
Datasets used in this visualization
-
IMERG
ID: 863This dataset can be found at: http://pmm.nasa.gov/sites/default/files/document_files/IMERG_ATBD_V4.4.pdf
See all pages that use this dataset -
NASA-USDA-FAS Soil Moisture (Surface Soil Moisture corrected with SMOS imagery and assimilated by the Ensemble Kalman Filter)
ID: 954The surface soil moisture product is corrected by integrating satellite-derived Soil Moisture Ocean Salinity (SMOS) mission surface soil moisture retrievals into the modified Palmer two-layer soil moisture model. The SMOS imagery helps to correct the modified Pal
See all pages that use this dataset
Note: While we identify the data sets used in these visualizations, we do not store any further details, nor the data sets themselves on our site.
Related
- ID: 12230
Used as a Source In
- ID: 31180
 Hyperwall Visual