March 2016 Total Solar Eclipse Path
The animated shadow path of the March 9, 2016 total solar eclipse, showing the umbra (black oval), penumbra (concentric shaded ovals), and path of totality (red) through Indonesia and the western Pacific.
This video is also available on our YouTube channel.
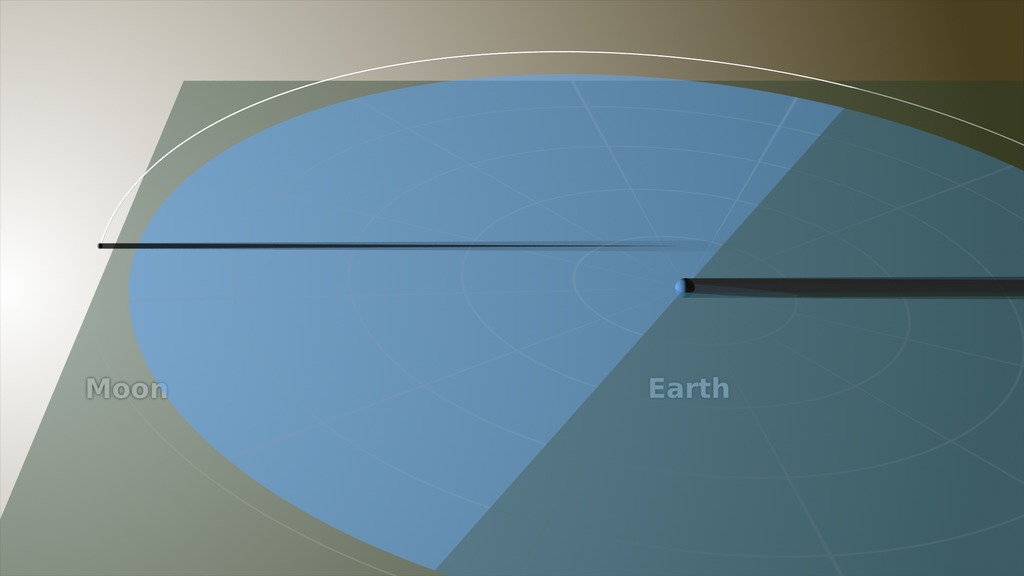
On Wednesday, March 9, 2016 (Tuesday evening in the Americas), the Moon will pass in front of the Sun, casting its shadow across Southeast Asia and the western Pacific. The shadow crosses the International Date Line, entering March 8, and passes Hawaii before it slides off the edge of the Earth.
The Moon's shadow can be divided into areas called the umbra and the penumbra. Within the penumbra, the Sun is only partially blocked, and observers experience a partial eclipse. The much smaller umbra lies at the very center of the shadow cone, and anyone there sees the Moon entirely cover the Sun in a total solar eclipse.
In the animation, the umbra is the small black oval. The red streak behind this oval is the path of totality. Anyone within this path will see a total eclipse when the umbra passes over them. The much larger shaded bullseye pattern represents the penumbra. Steps in the shading denote different percentages of Sun coverage (eclipse magnitude), at levels of 90%, 75%, 50% and 25%. The yellow and orange contours map the path of the penumbra. The outermost yellow contour is the edge of the penumbra path. Outside this limit, no part of the Sun is covered by the Moon.
The numbers in the lower left corner give the latitude and longitude of the center of the umbra as it moves eastward, along with the altitude of the Sun above the horizon at that point. Also shown is the duration of totality: for anyone standing at the center point, this is how long the total solar eclipse will last. Note that the duration varies from just 2 minutes over eastern Indonesia to over 4 minutes on the Woleai Atoll in Micronesia.
Go here for details about the methods and parameters used to make this visualization.
The animated shadow path of the March 9, 2016 total solar eclipse, showing the umbra (black oval), penumbra (concentric shaded ovals), and path of totality (red). This version omits the geographical labels and the statistics display.
The animated shadow path of the March 9, 2016 total solar eclipse, showing the umbra (black oval), penumbra (concentric shaded ovals), and path of totality (red). The appearance of the Sun relative to the local horizon is shown for eight locations.
Credits
Please give credit for this item to:
NASA/Goddard Space Flight Center Scientific Visualization Studio
-
Visualizers
- Ernie Wright (USRA)
- Tom Bridgman (Global Science and Technology, Inc.)
- Alex Kekesi (Global Science and Technology, Inc.)
-
Programmer
- Ernie Wright (USRA)
-
Producer
- Genna Duberstein (USRA)
Release date
This page was originally published on Friday, February 12, 2016.
This page was last updated on Tuesday, November 14, 2023 at 12:07 AM EST.
Datasets used in this visualization
-
BMNG (Blue Marble: Next Generation) [Terra and Aqua: MODIS]
ID: 508Credit: The Blue Marble data is courtesy of Reto Stockli (NASA/GSFC).
This dataset can be found at: http://earthobservatory.nasa.gov/Newsroom/BlueMarble/
See all pages that use this dataset -
DE421 (JPL DE421)
ID: 752Planetary ephemerides
This dataset can be found at: http://ssd.jpl.nasa.gov/?ephemerides#planets
See all pages that use this dataset
Note: While we identify the data sets used in these visualizations, we do not store any further details, nor the data sets themselves on our site.
Related
- ID: 12165
 Produced Video
 - ID: 4424
 Visualization
 - ID: 4425
 Visualization
 - ID: 4426
 Visualization
Used as a Source In
- ID: 12170
 Produced Video
 - ID: 12147
 Produced Video