GPM Examines East Coast Snow Storm
On March 17, 2014 the Global Precipitation Measurement (GPM) mission's Core Observatory flew over the East coast's last snow storm of the 2013-2014 winter season. This was also one of the first major snow storms observed by GPM shortly after it was launched on February 27, 2014.
The GPM Core Observatory carries two instruments that show the location and intensity of rain and snow, which defines a crucial part of the storm structure – and how it will behave. The GPM Microwave Imager sees through the tops of clouds to observe how much and where precipitation occurs, and the Dual-frequency Precipitation Radar observes precise details of precipitation in 3-dimensions.
For forecasters, GPM's microwave and radar data are part of the toolbox of satellite data, including other low Earth orbit and geostationary satellites, that they use to monitor tropical cyclones and hurricanes.
The addition of GPM data to the current suite of satellite data is timely. Its predecessor precipitation satellite, the Tropical Rainfall Measuring Mission, is 18 years into what was originally a three-year mission. GPM's new high-resolution microwave imager data and the unique radar data ensure that forecasters and modelers won't have a gap in coverage. GPM is a joint mission between NASA and the Japan Aerospace Exploration Agency. All GPM data products will be released to the public on September 4, 2104. Current and future data sets are available to registered users from NASA Goddard's Precipitation Processing Center website.
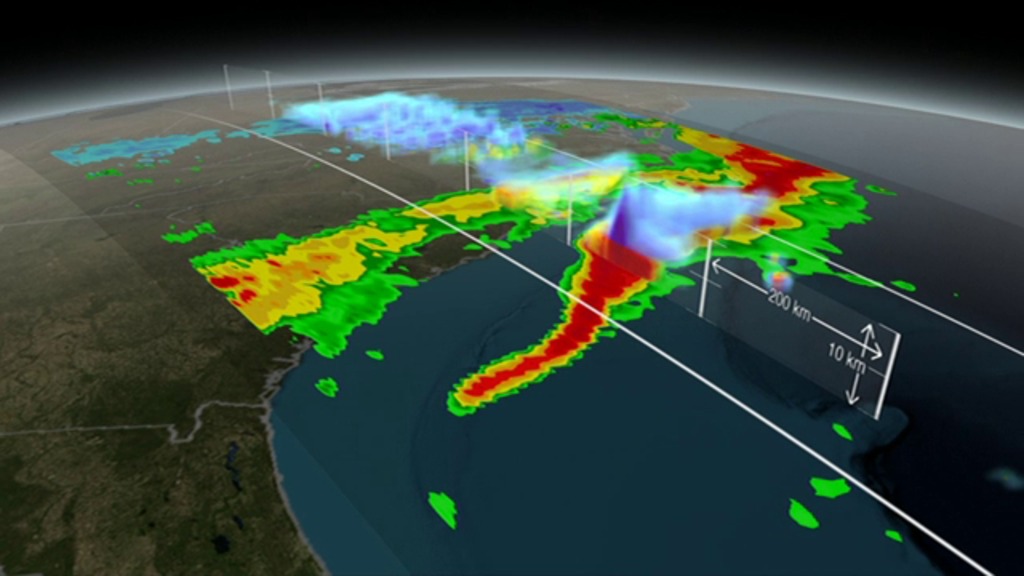
Visualization of GPM collecting data on March 17th, 2014 over the last major snow storm of winter 2013-2014 to hit the east coast. The animation begins with GPM/GMI collecting a swath of ground rain rate data across the region of interest. A volumetric dataset of rain rates (taken by DPR) then dissolves in to show the structure of the storm. A dissecting plane is then turned on to not only provide relative height and width information for the storm, but it then slices through the storm to reveal some of the storm's interior structure. Shades of green to red indicate areas of liquid precipitation. Shades of cyan to purple are areas of frozen precipitation. GPM is the first satellite to differentiate between liquid and frozen precipitation.

Colorbar for frozen precipitation rates (ie, snow rates). Shades of cyan represent low amounts of frozen precipitation, whereas shades of purple represent high amounts of precipitation.

Colorbar for liquid precipitation rates (ie, rain rates). Shades of green represent low amounts of liquid precipitation, whereas shades of red represent high amounts of precipitation.

An annotated snapshot of the east coast snow storm event.
The raw image used to create the above annotated print resolution still.
A side view of the east coast snow storm highlighting the band of liquid precipitation under the frozen precipitation layer.
The raw print resolution still used to create the above annotated cross section.
An annotated print resolution still of the east coast snow storm viewing the storm in a south easterly direction. (The bottom left corner is North. Upper left corner is East. Upper right corner is South. Lower right corner is West.)
Raw print resolution still used to create the annotated version above.
Credits
Please give credit for this item to:
NASA's Scientific Visualization Studio
-
Animators
- Alex Kekesi (Global Science and Technology, Inc.)
- Greg Shirah (NASA/GSFC)
- Trent L. Schindler (USRA)
-
Producers
- Ryan Fitzgibbons (USRA)
- Rani Gran (NASA/GSFC)
-
Scientists
- Gail Skofronick Jackson (NASA/GSFC)
- Dalia B Kirschbaum (NASA/GSFC)
- George Huffman (NASA/GSFC)
-
Project support
- Laurence Schuler (ADNET Systems, Inc.)
- Ian Jones (ADNET Systems, Inc.)
- Robert Simmon (Sigma Space Corporation)
- Jesse Allen (Sigma Space Corporation)
-
Writer
- Ellen T. Gray (ADNET Systems, Inc.)
Release date
This page was originally published on Thursday, September 4, 2014.
This page was last updated on Tuesday, November 14, 2023 at 12:05 AM EST.
Missions
This visualization is related to the following missions:Series
This visualization can be found in the following series:Datasets used in this visualization
-
[EO-1: ALI]
ID: 13This dataset can be found at: http://eo1.gsfc.nasa.gov/Technology/ALIhome1.htm
See all pages that use this dataset -
Rain Rates (Surface Precipitation) [GPM: GMI]
ID: 822Credit: Data provided by the joint NASA/JAXA GPM mission.
See all pages that use this dataset -
Volumetric Precipitation data (Ku) [GPM: DPR]
ID: 830Credit: Data provided by the joint NASA/JAXA GPM mission.
See all pages that use this dataset
Note: While we identify the data sets used in these visualizations, we do not store any further details, nor the data sets themselves on our site.
Related
- ID: 11635
 Produced Video