Ocean Color Time Series
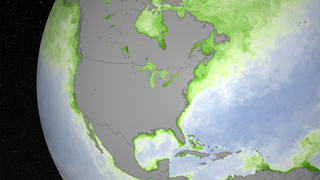
Ocean Color, July 2002 - March 2017
This visualization, derived using data from the Moderate Resolution Imaging Spectroradiometer (MODIS) onboard NASA’s Aqua satellite, shows monthly sea surface chlorophyll from July 2002 through February 2016. Chlorophyll is a proxy for phytoplankton abundance. Phytoplankton are microscopic algae: primary producers that turn sunlight into chemical energy that supports the ocean food web. Darker shades of green indicate more chlorophyll, more phytoplankton, while darker shades of blue indicate less chlorophyll and less phytoplankton. White represents the mode value of chlorophyll in the global ocean.
Like plants on land, phytoplankton need sunlight and nutrients to bloom. The main source of ocean nutrients comes from cold, deep ocean water that wells up to the surface, called upwelling. The circulation of the ocean and atmosphere determine where nutrients upwell. Areas of upwelling, and thus phytoplankton productivity, include the subpolar gyres, along the equator, along the west coast of continents, along western boundary currents (e.g., Gulf Stream) and near islands. Other sources of nutrients to the ocean surface include run-off from land and atmospheric deposition of minerals (e.g., desert dust).
Phytoplankton bloom patterns change with short-term weather systems (e.g., the passage of tropical storms), with the seasons, and with longer-term climate patterns such as El Niño. Ocean color satellite data such as these allow scientists to study global phytoplankton distribution, crucial for understanding the differences between long-term trends caused by natural oscillations and anthropogenic climate changes (i.e., ocean warming, stratification, acidification).
The Ocean Biology Processing Group at NASA’s Goddard Space Flight Center processed the data and the Environmental Visualization Lab at NOAA’s National Environmental Satellite, Data and Information Service (NESDIS) produced the monthly maps.
Ocean Color, July 2002 - December 2015
Ocean Color, July 2002 - December 2015

Ocean Color colorbar alone
Credits
Please give credit for this item to:
NASA's Goddard Space Flight Center
-
Animator
- Amy Moran (Global Science and Technology, Inc.)
-
Scientist
- Stephanie Uz (Global Science and Technology, Inc.)
Release date
This page was originally published on Thursday, March 17, 2016.
This page was last updated on Tuesday, November 14, 2023 at 12:31 AM EST.
