Tracking Volcanic Ash With Satellites
Data from the Suomi NPP satellite is used by NASA scientists to map the full three-dimensional structure of volcanic clouds, allowing a more accurate forecast of where the volcanic ash is spreading. The information will be used by air traffic management to re-route flights around the hazardous ash clouds, which can damage airplane engines.
Complete transcript available.
Music: "Dangerous Clouds" by Guy & Zab Skornik [SACEM]
Watch this video on the NASA Goddard YouTube channel.
Volcano eruptions can wreak havoc on airplanes that fly through the clouds of ash and sulfur dioxide. The ash, in particular, can destroy a jet engine and even cause it to fail mid-flight. However, it can be difficult to detect the ash clouds, because they often look like ordinary rain clouds on radar and to the pilot's eye. To be cautious, volcanic eruptions are given a wide berth, leading to costly delays and cancellations.
NASA scientist Nickolay Krotkov is developing a new way to map the full three-dimensional structure of the volcanic cloud. The NASA/NOAA/DoD Suomi NPP satellite maps the concentration of sulfur dioxide and volcanic aerosols using the Ozone Mapping Profiler Suite (OMPS). After it passes the volcanic plume, the OMPS Limb Profiler looks backwards and measures the vertical profile of the cloud in three separate slices.
The location and height of the particles, as well as the amount of sulfur dioxide, is being integrated into models of weather patterns to forecast the spread of the volcanic cloud. The high resolution of the vertical profiles allows a more accurate forecast in the days, weeks, and months after an eruption, which could reduce airline cancellations and re-routing costs.
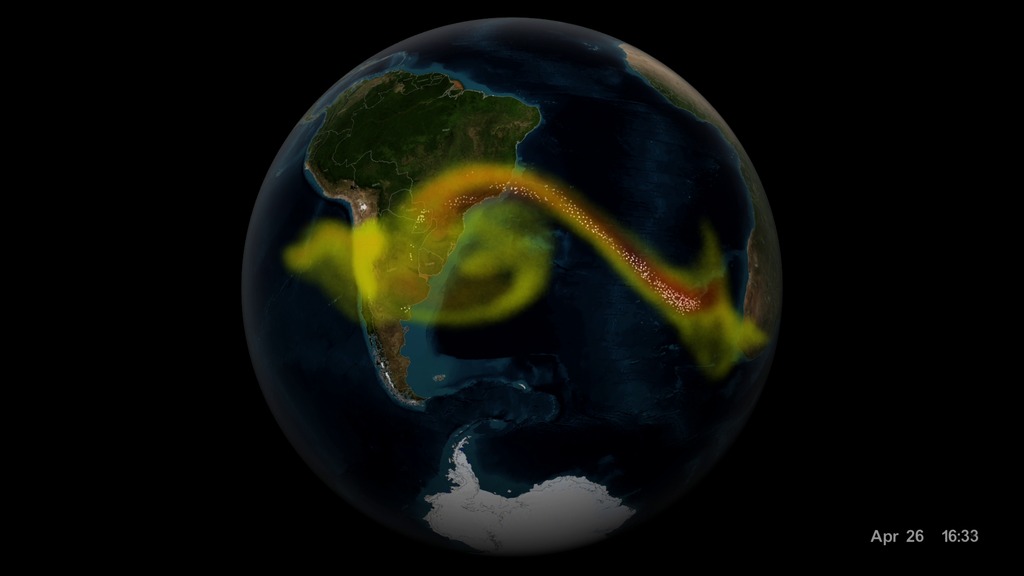
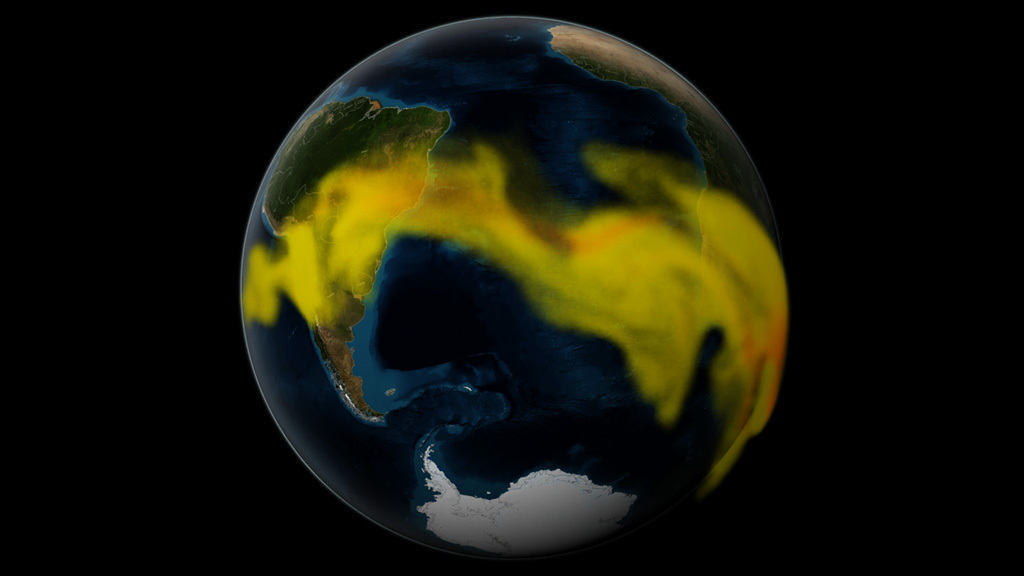
Visualization of results from a supercomputer model of ash and sulfur dioxide spreading from an eruption of the Calbuco volcano in April 2015. The supercomputer combines the physics and chemistry of the atmosphere with data from the NASA/NOAA/DoD Suomi NPP satellite to model the full three-dimensional structure of the volcanic cloud.

Print still - GEOS-5 model data depicting Sulfur Dioxide (yellow/red) and volcanic ash (white dots) following an eruption
Print still - GEOS-5 model data depicting Sulfur Dioxide (yellow/red) and volcanic ash (white dots) following an eruption
Print still - GEOS-5 model data depicting Sulfur Dioxide (yellow/red) and volcanic ash (white dots) following an eruption
Print still - GEOS-5 model data depicting Sulfur Dioxide (yellow/red) and volcanic ash (white dots) is compared to observed OMPS Limb Extinction data
Print still - GEOS-5 model data depicting Sulfur Dioxide (yellow/red) and volcanic ash (white dots) is compared to observed OMPS Limb Extinction data
Print still - GEOS-5 model data depicting Sulfur Dioxide (yellow/red) and volcanic ash (white dots) is compared to observed OMPS Limb Extinction data
Color bar for Aerosol Extinction 674nm
Color bar for sulfur dioxide (so2) concentration in milligrams per cubic meter
Legend for volcanic ash concentration
For More Information
See NASA.gov
Credits
Please give credit for this item to:
NASA's Goddard Space Flight Center
Music: "Dangerous Clouds" by Guy & Zab Skornik [SACEM]
-
Producer
- Matthew R. Radcliff (USRA)
-
Technical support
- Aaron E. Lepsch (ADNET Systems, Inc.)
-
Animator
- Kel Elkins (USRA)
-
Scientists
- Nickolay Krotkov (NASA/GSFC)
- Eric J. Hughes (UMD)
-
Narrator
- Jefferson Beck (USRA)
-
Writers
- Audrey Haar (Telophase)
- Matthew R. Radcliff (USRA)
Release date
This page was originally published on Thursday, May 12, 2016.
This page was last updated on Tuesday, November 14, 2023 at 12:19 AM EST.
Series
This visualization can be found in the following series:Related
- ID: 12257
Used as a Source In
- ID: 12246
 Produced Video