Active Region on the Sun Emits Another Flare
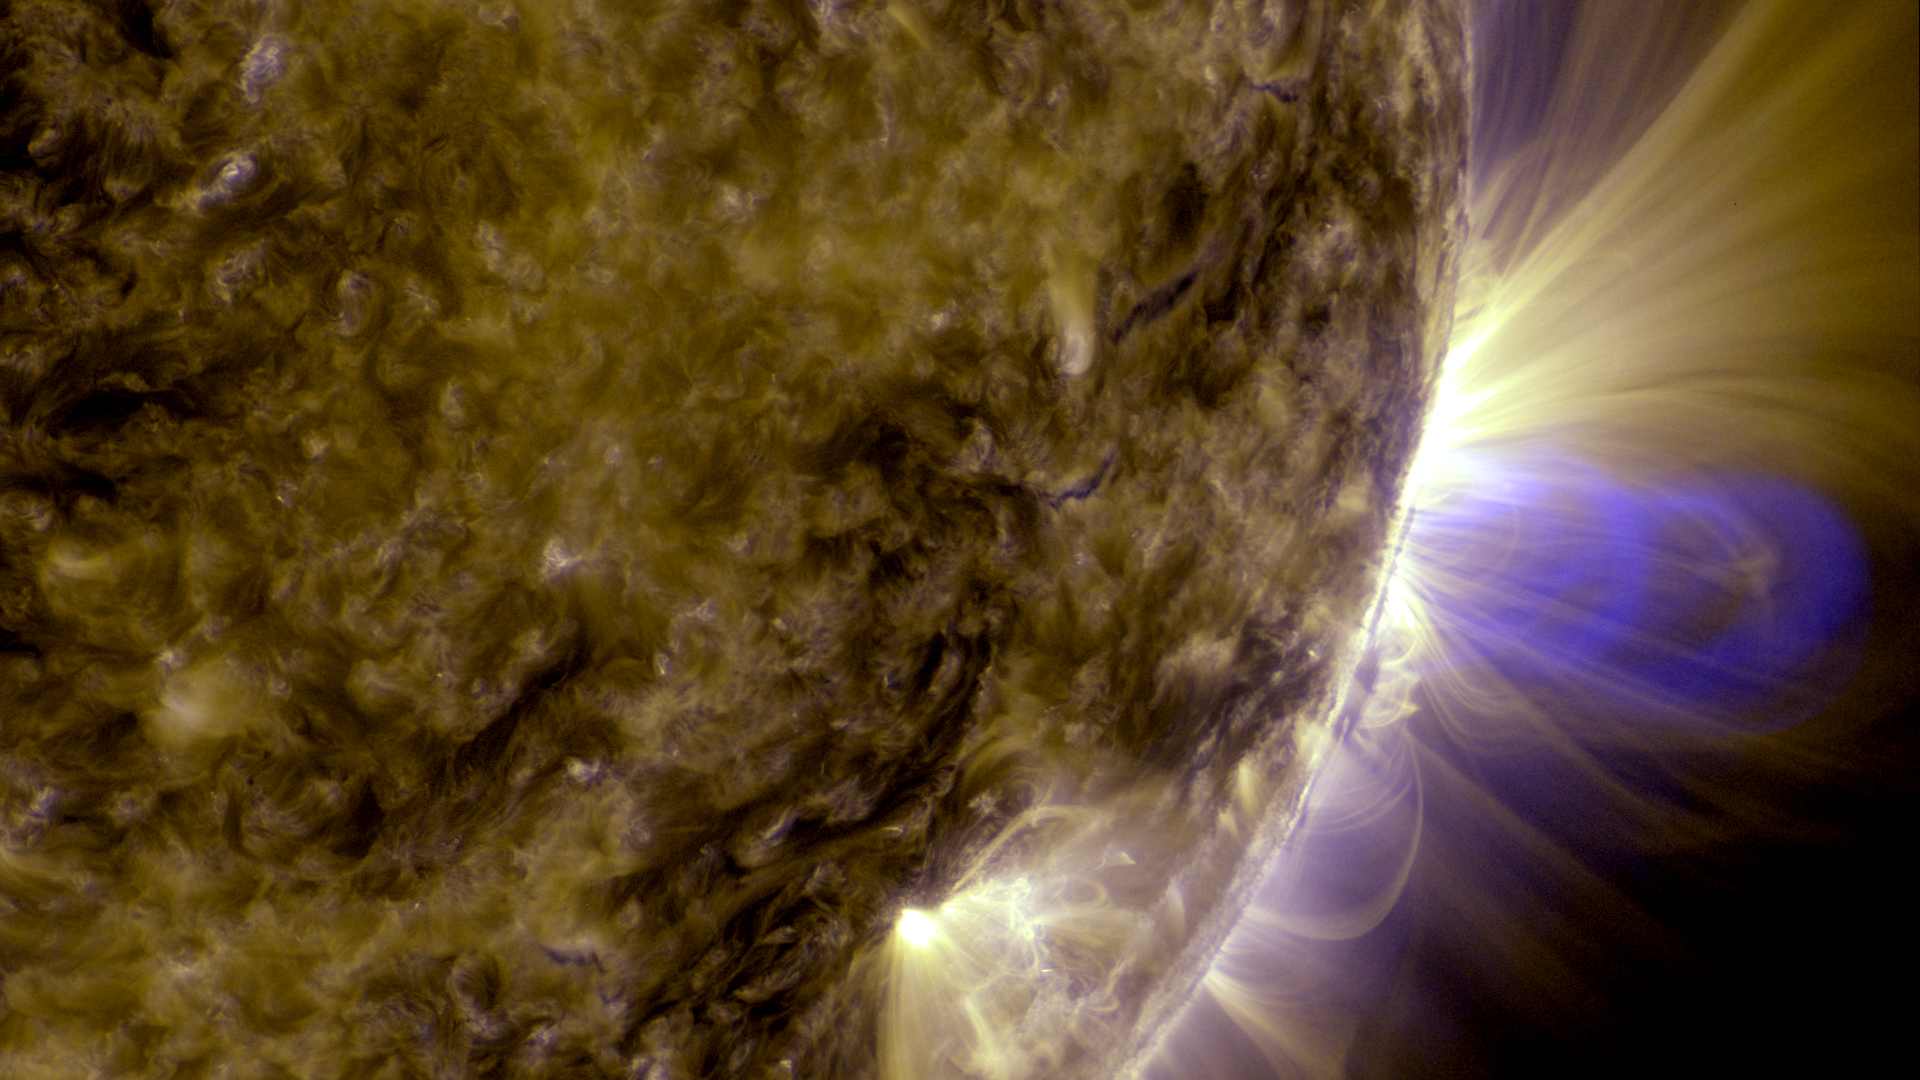
The sun emitted a significant solar flare on Oct. 22, 2012, peaking at 11:17 p.m. EDT. The flare came from an active region on the left side of the sun that has been numbered AR 1598, which has already been the source of a number of weaker flares. This flare was classified as an X.1-class flare.
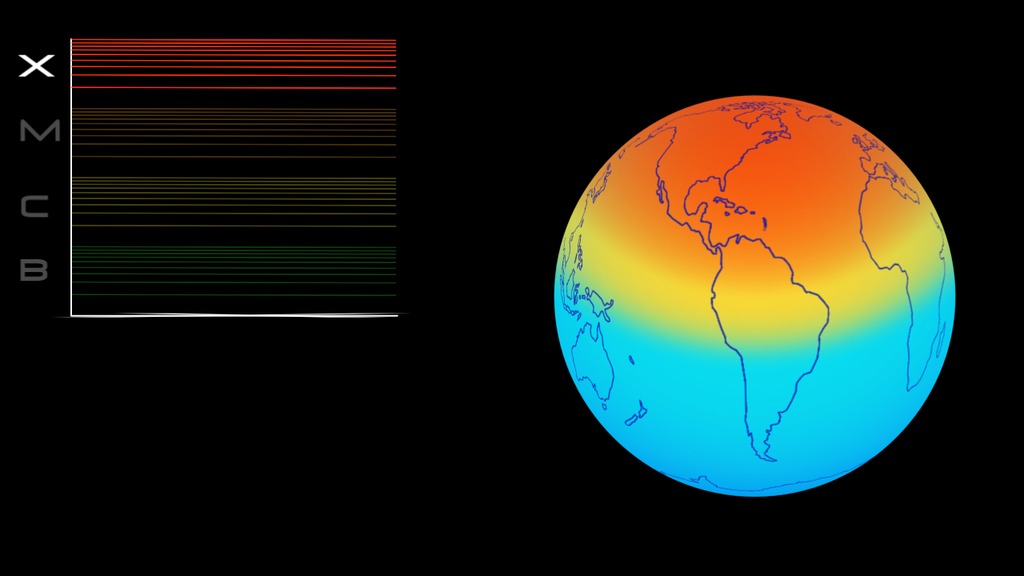
"X-class" denotes the most intense flares, while the number provides more information about its strength. An X2 is twice as intense as an X1, an X3 is three times as intense, and on. An X-class flare of this intensity can cause degradation or blackouts of radio communications for about an hour.
Solar flares are powerful bursts of radiation. Harmful radiation from a flare cannot pass through Earth's atmosphere to physically affect humans on the ground, however — when intense enough — they can disturb the atmosphere in the layer where GPS and communications signals travel. This can disrupt radio signals for anywhere from minutes to hours.
The National Oceanic and Atmospheric Association, which is the United States government's official source for space weather forecasts and alerts, categorized the radio blackout associated with this flare as an R3, on a scale from R1 to R5. It has since subsided.
Increased numbers of flares are quite common at the moment, since the sun's normal 11-year activity cycle is ramping up toward solar maximum, which is expected in 2013. Humans have tracked this solar cycle continuously since it was discovered in 1843, and it is normal for there to be many flares a day during the sun's peak activity. The first X-class flare of the current solar cycle occurred on Feb. 15, 2011 and there have been 15 X-class flares total in this cycle, including this one. The largest X-class flare in this cycle was an X6.9 on Aug. 9, 2011. This is the 7th X-class flare in 2012 with the largest being an X5.4 flare on March 7.
This flare did not have an associated Earth-directed coronal mass ejection (CME), another solar phenomenon that can send solar particles into space and affect electronic systems in satellites and on Earth.
Watch this video on YouTube.
Video of a solar flare on Oct. 22, 2012 as captured by NASA's Solar Dynamics Observatory (SDO) in the 131 and 304 angstrom wavelengths. The 131 wavelength of light is used for observing solar material heated to 10 million degrees Kelvin, as in a solar flare. The wavelength is typically colorized in teal, as it is here.
Credit: NASA/SDO/GSFC

By observing the sun in a number of different wavelengths, NASA's telescopes can tease out different aspects of events on the sun. These four images of a solar flare on Oct. 22, 2012, show from the top left, and moving clockwise: light from the sun in the 171 angstrom wavelength, which shows the structure of loops of solar material in the sun's atmosphere, the corona; light in 335 angstroms, which highlights light from active regions in the corona; a magnetogram, which shows magnetically active regions on the sun; light in the 304 wavelength, which shows light from the region of the sun's atmosphere where flares originate.
Credit: NASA/SDO/GSFC
The October 22 X1.8 flare in a blended 304-Magnetogram image.
Credit: NASA/SDO/GSFC
The October 22 X1.8 flare in a blended 304-Magnetogram image. Cropped.
Credit: NASA/SDO/GSFC
A solar flare on Oct. 22, 2012 as captured by NASA's Solar Dynamics Observatory (SDO) in the 131 angstrom wavelength. This wavelength of light is used for observing solar material heated to 10 million degrees Kelvin, as in a solar flare. The wavelength is typically colorized in teal, as it is here.
Credit: NASA/SDO
The October 22 flare in 335
The October 22 flare in 304
For More Information
Credits
Please give credit for this item to:
NASA/Goddard Space Flight Center. However, individual images should be credited as indicated above.
-
Video editor
- Scott Wiessinger (USRA)
-
Producers
- Scott Wiessinger (USRA)
- Genna Duberstein (USRA)
-
Writer
- Karen Fox (ADNET Systems, Inc.)
Release date
This page was originally published on Tuesday, October 23, 2012.
This page was last updated on Wednesday, May 3, 2023 at 1:52 PM EDT.
Missions
This visualization is related to the following missions:Series
This visualization can be found in the following series:Tapes
This visualization originally appeared on the following tapes:-
Heliophysics Breaking News 2012 collection
(ID: 2012048)
Thursday, November 1, 2012 at 4:00AM
Produced by - Robert Crippen (NASA)
Related
- ID: 11203
 Produced Video
 - ID: 10959
 Produced Video
 - ID: 10109
 Produced Video